I'm Noah Doersing, my favorite pasta shape is radiatori, and I've recently graduated with a Master's degree in media informatics from the University of Tübingen – now, I make computers go brrrrrr at SüdWestStrom.
A simple Pandoc-powered static site generator for the user's recipe collection. Implemented as a small, portable Bash script, this tool takes a collection of Markdown-formatted recipes and turns it into a lightweight, responsive, searchable website for personal use as a reference while cooking, or for sharing with family and friends.
Nyum is somewhat opinionated, expecting recipes to be written as a series of steps, each with the relevant ingredients alongside an instruction. I first came across this way of doing it via the cuisine LaTeX package (which I had built a custom, now-redundant LaTeX template around), ending up preferring this structure over the more commonly found all-ingredients-first-then-a-block-of-instructions approach.
The generated website as it would appear on iPads – the index page (with an active search) on the left and a recipe page on the right. You can check out a demo here.
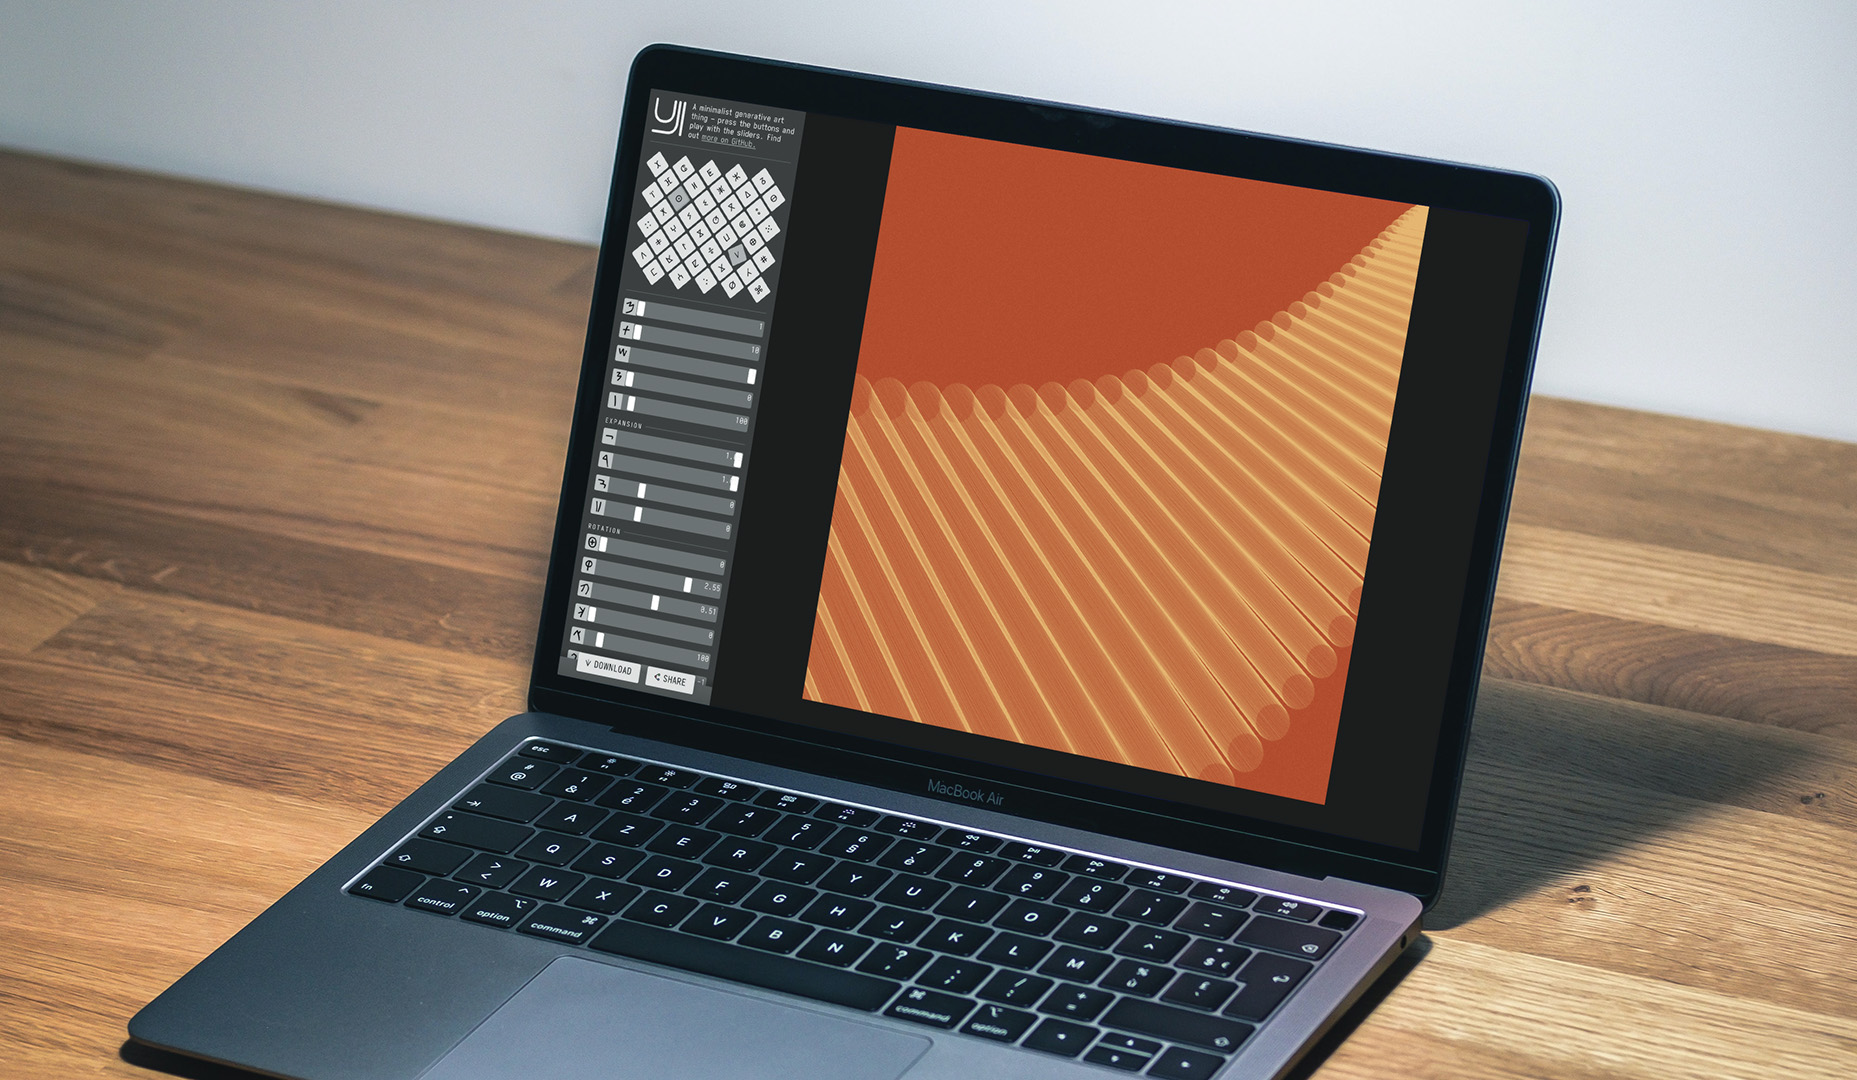
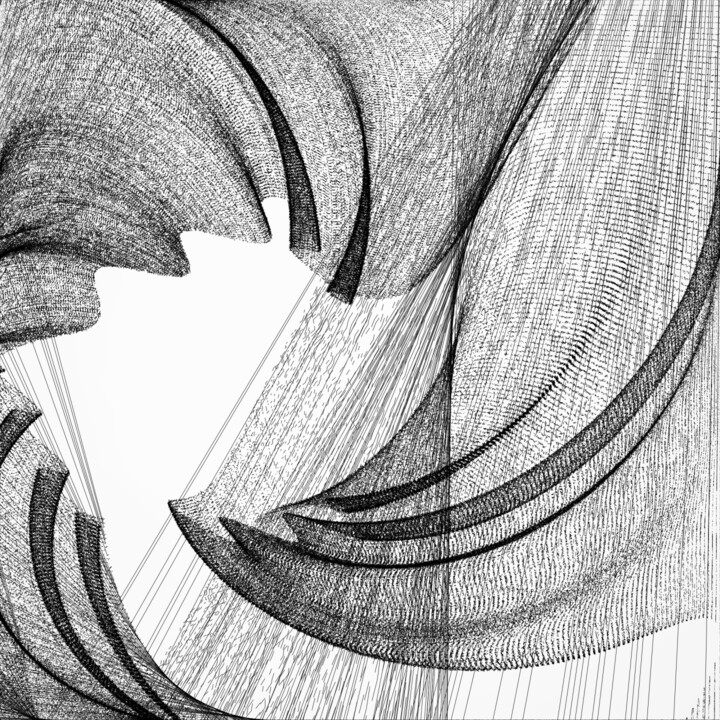
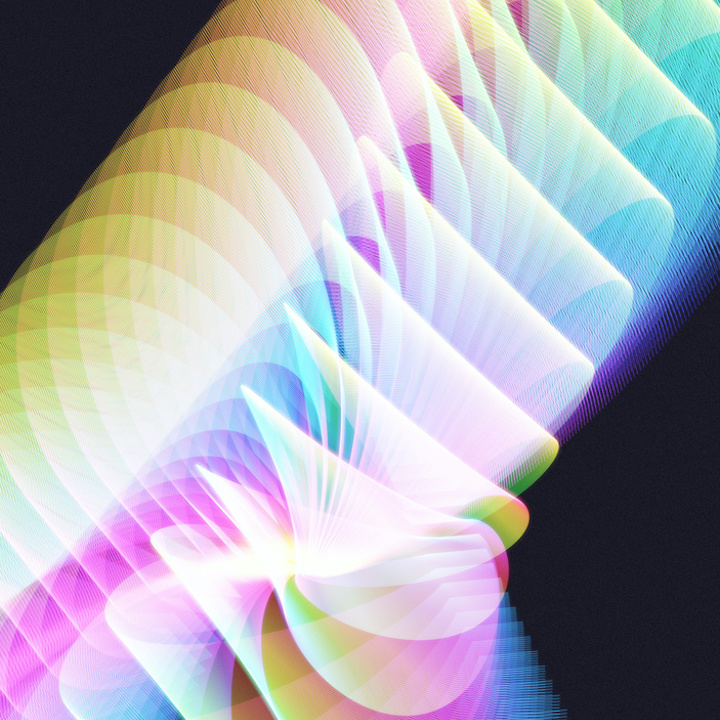
A minimalist, web-based generative art creation tool – a smorgasbord of range sliders allows the user to specify a set of parameters steering the behavior of a basic line drawing loop. The interface is deliberately designed to encourage exploration through play (as opposed to analytic thinking). Read this blog post for more information.
The resulting drawings are ready to be downloaded as images or shared through links like this one – alternatively, the line geometry can be exported in SVG and JSON format for, say, picturesquepenplottingpurposes (eachoftheselinks points to a plot).
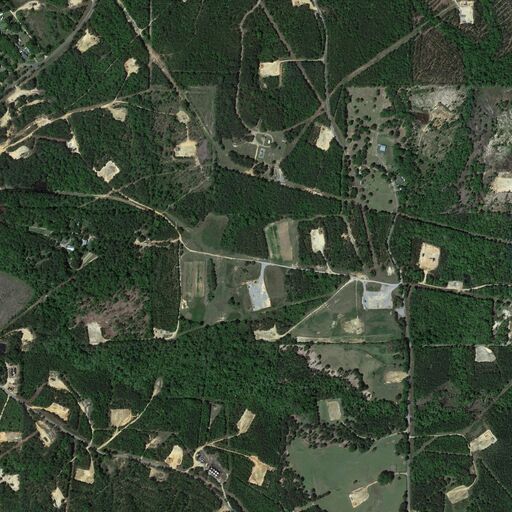
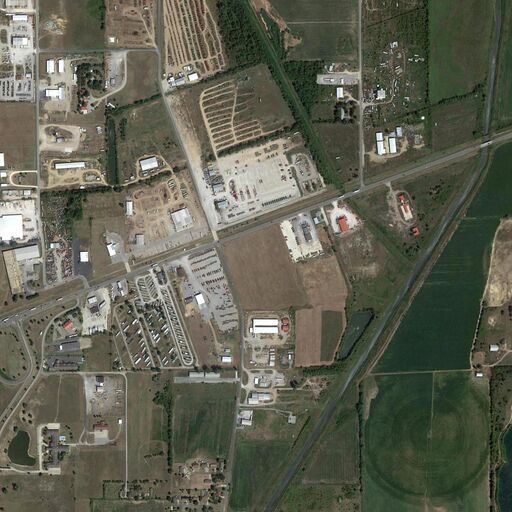
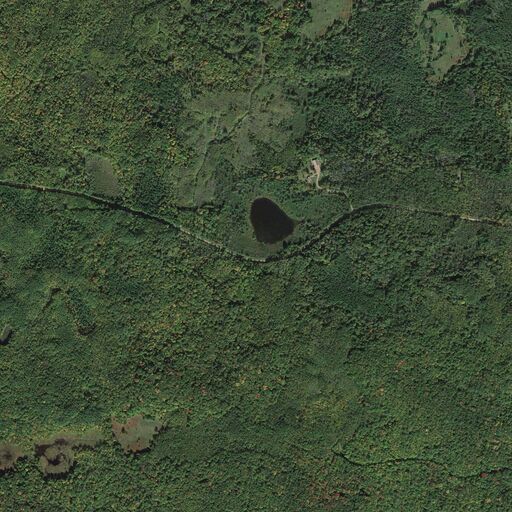
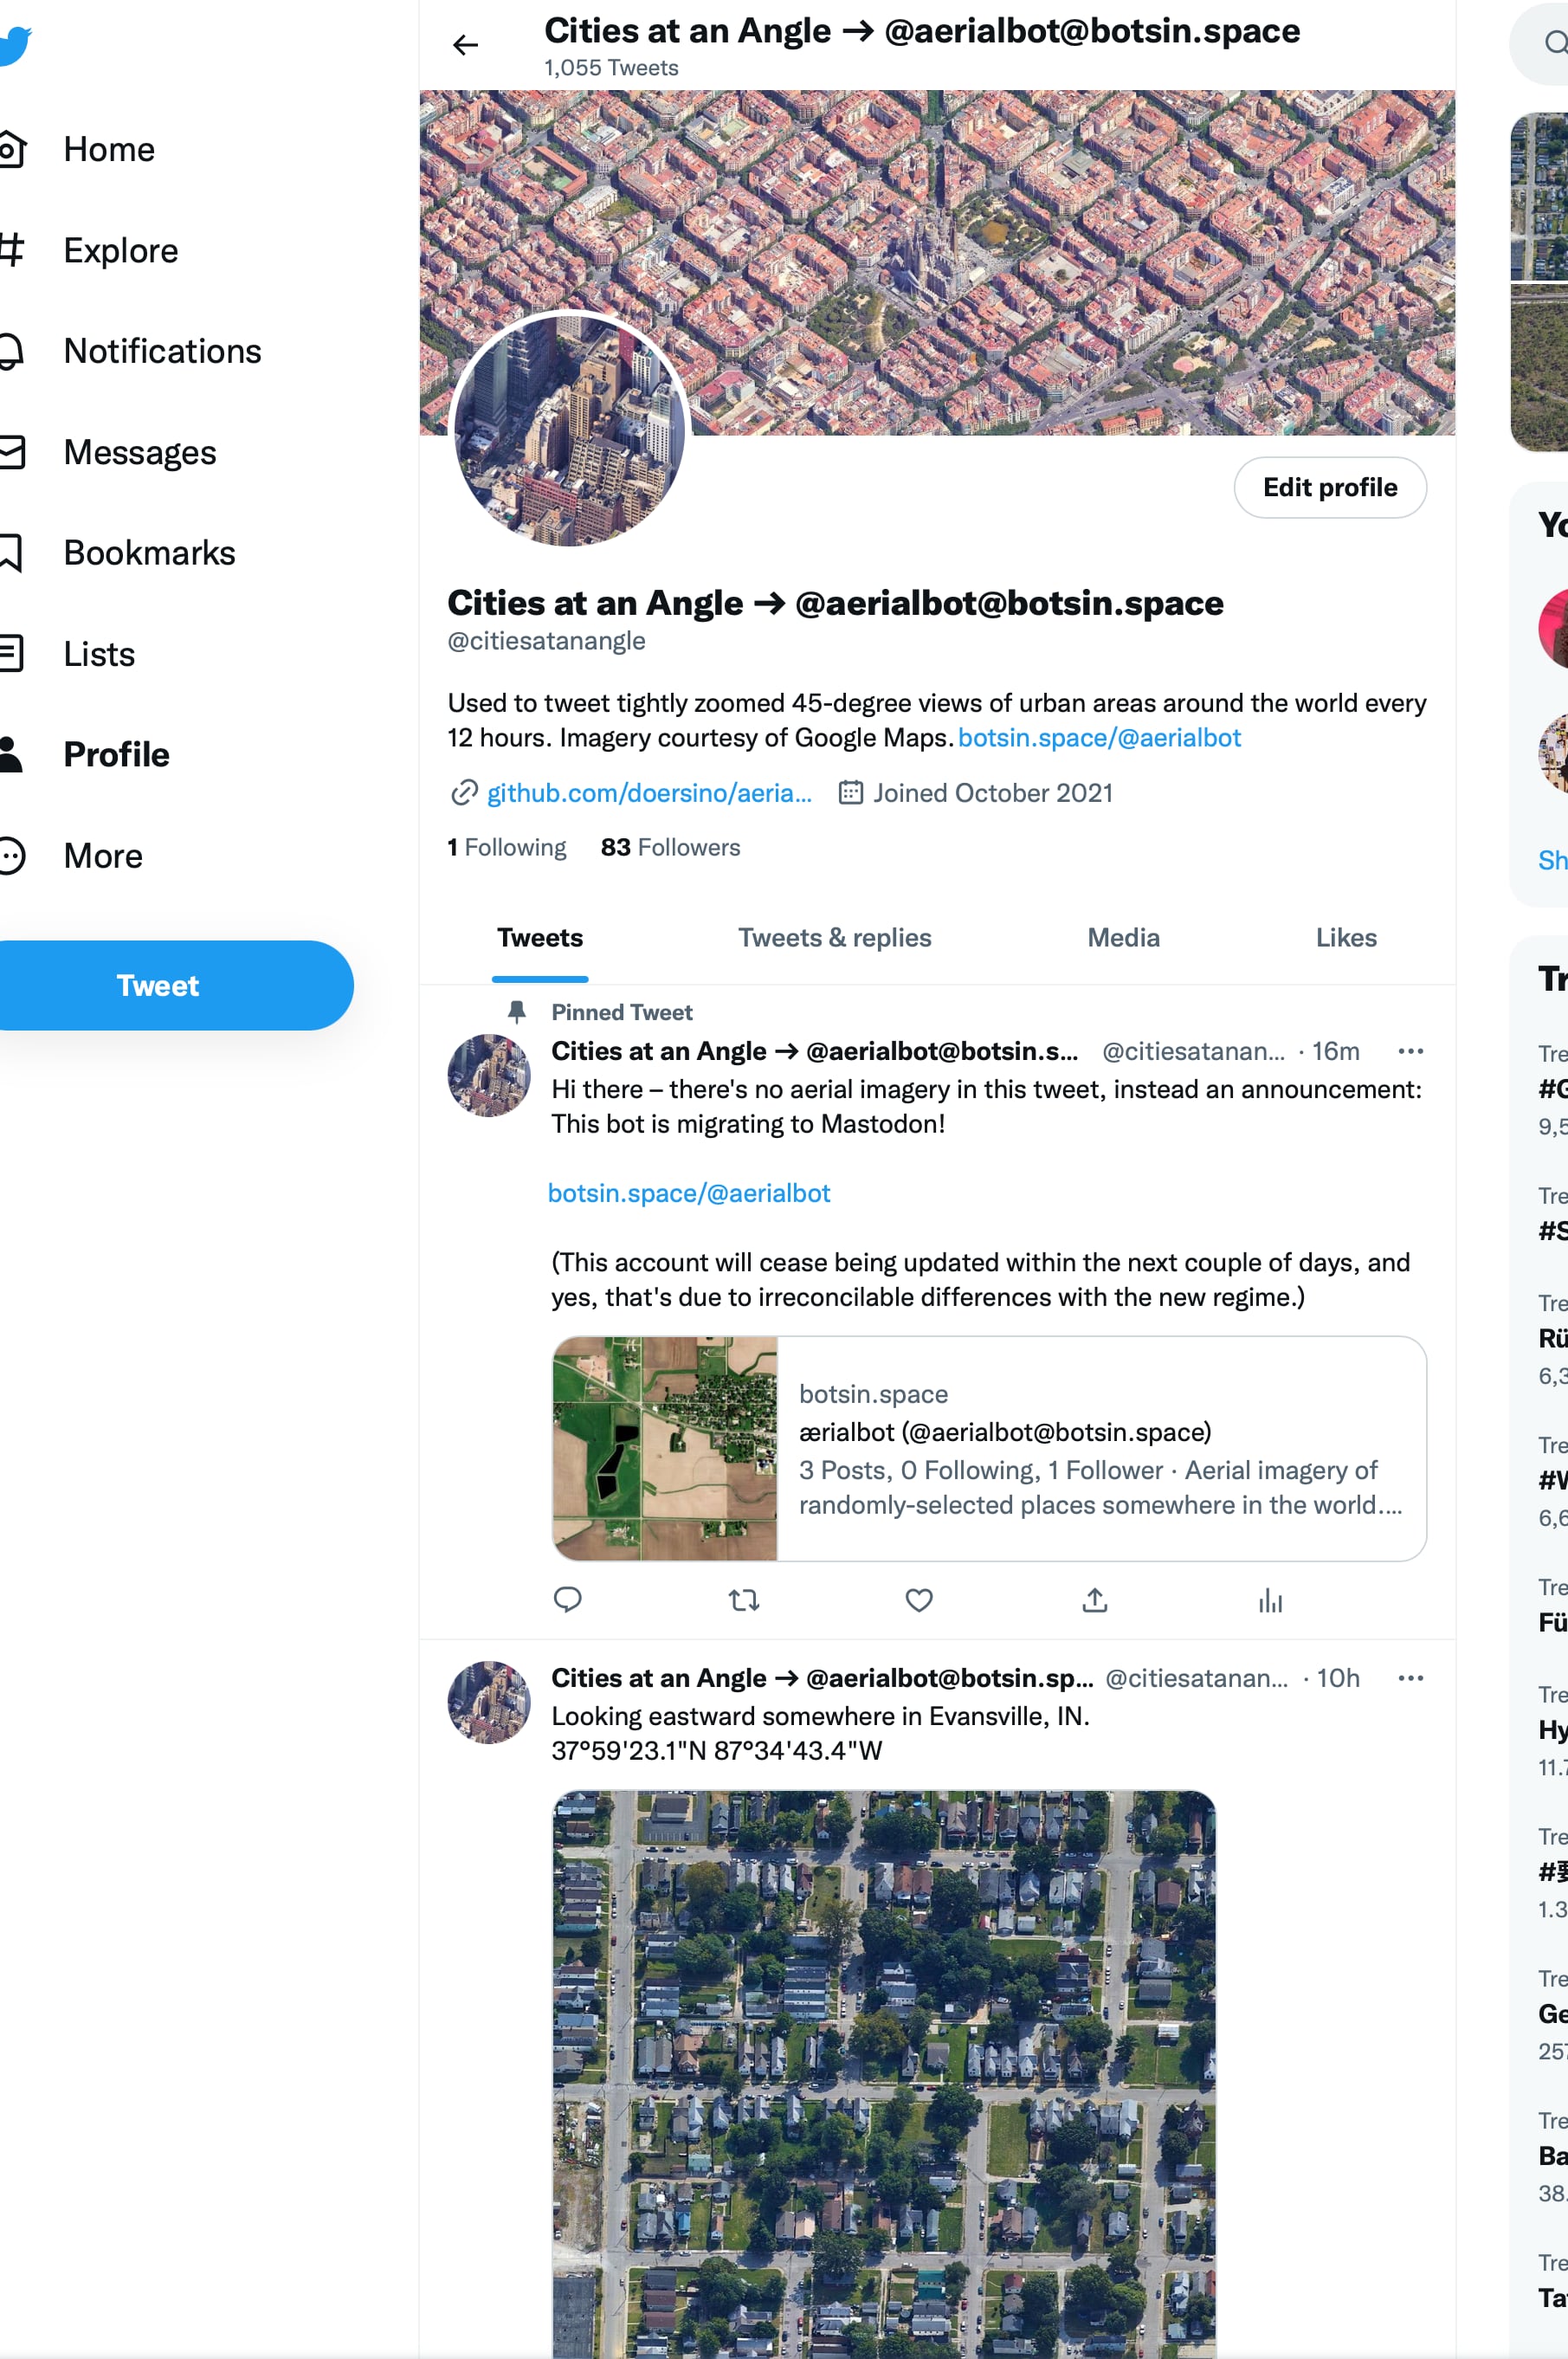
Satellite imagery like the kind available on Google Maps and competing services can be extremely beautiful and interesting. Built with the goal of powering a couple of Twitter bots (which I've since migrated to Mastodon at @aerialbot@mastodon.social), the Python-based ærialbot generates a random point within the bounds of a shapefile, grabs satellite imagery of a user-defined area around it at a user-defined scale, stitches the downloaded map tiles together into an image, and optionally tweets it along with geotagging metadata.
As of late 2022, there were around ~10 active instances of ærialbot – some run by me, the rest by various cool folks – with more than 1000 followers between them. Due to the fallout from Elon Musk's Twitter takeover, none are left there – only @aerialbot@mastodon.social is still active.
I had previously built gomati, a bash script that served as a proof-of-concept for ærialbot.
A sample of the kinds of images an America-focused ærialbot instance might post.
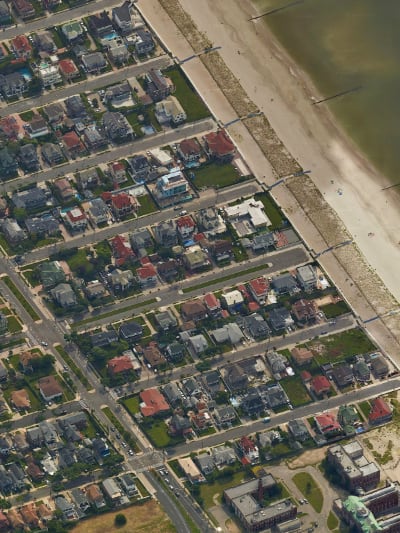
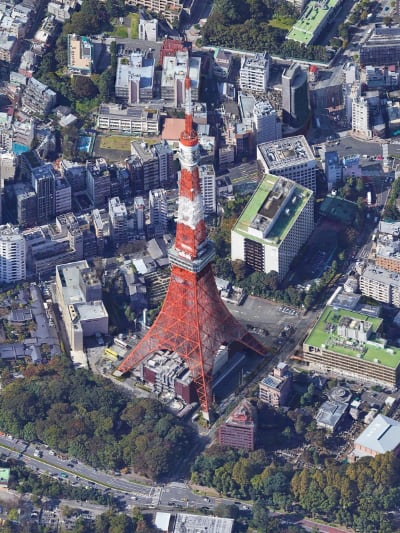
Unlike the other ærialbot instances, which "look" straight down, @citiesatanangle tweeted 45-degree views of (sub)urban areas around the world. This imagery is rendered from 3D data available on Google Maps.
The command-line interface of ærialbot. The progress indicator runs on a different thread, updating periodically as ærialbot does its thing.
The ærialbot lite widget running on my ancient-but-still-just-fine iPhone 7.
돈돈돈2015–now
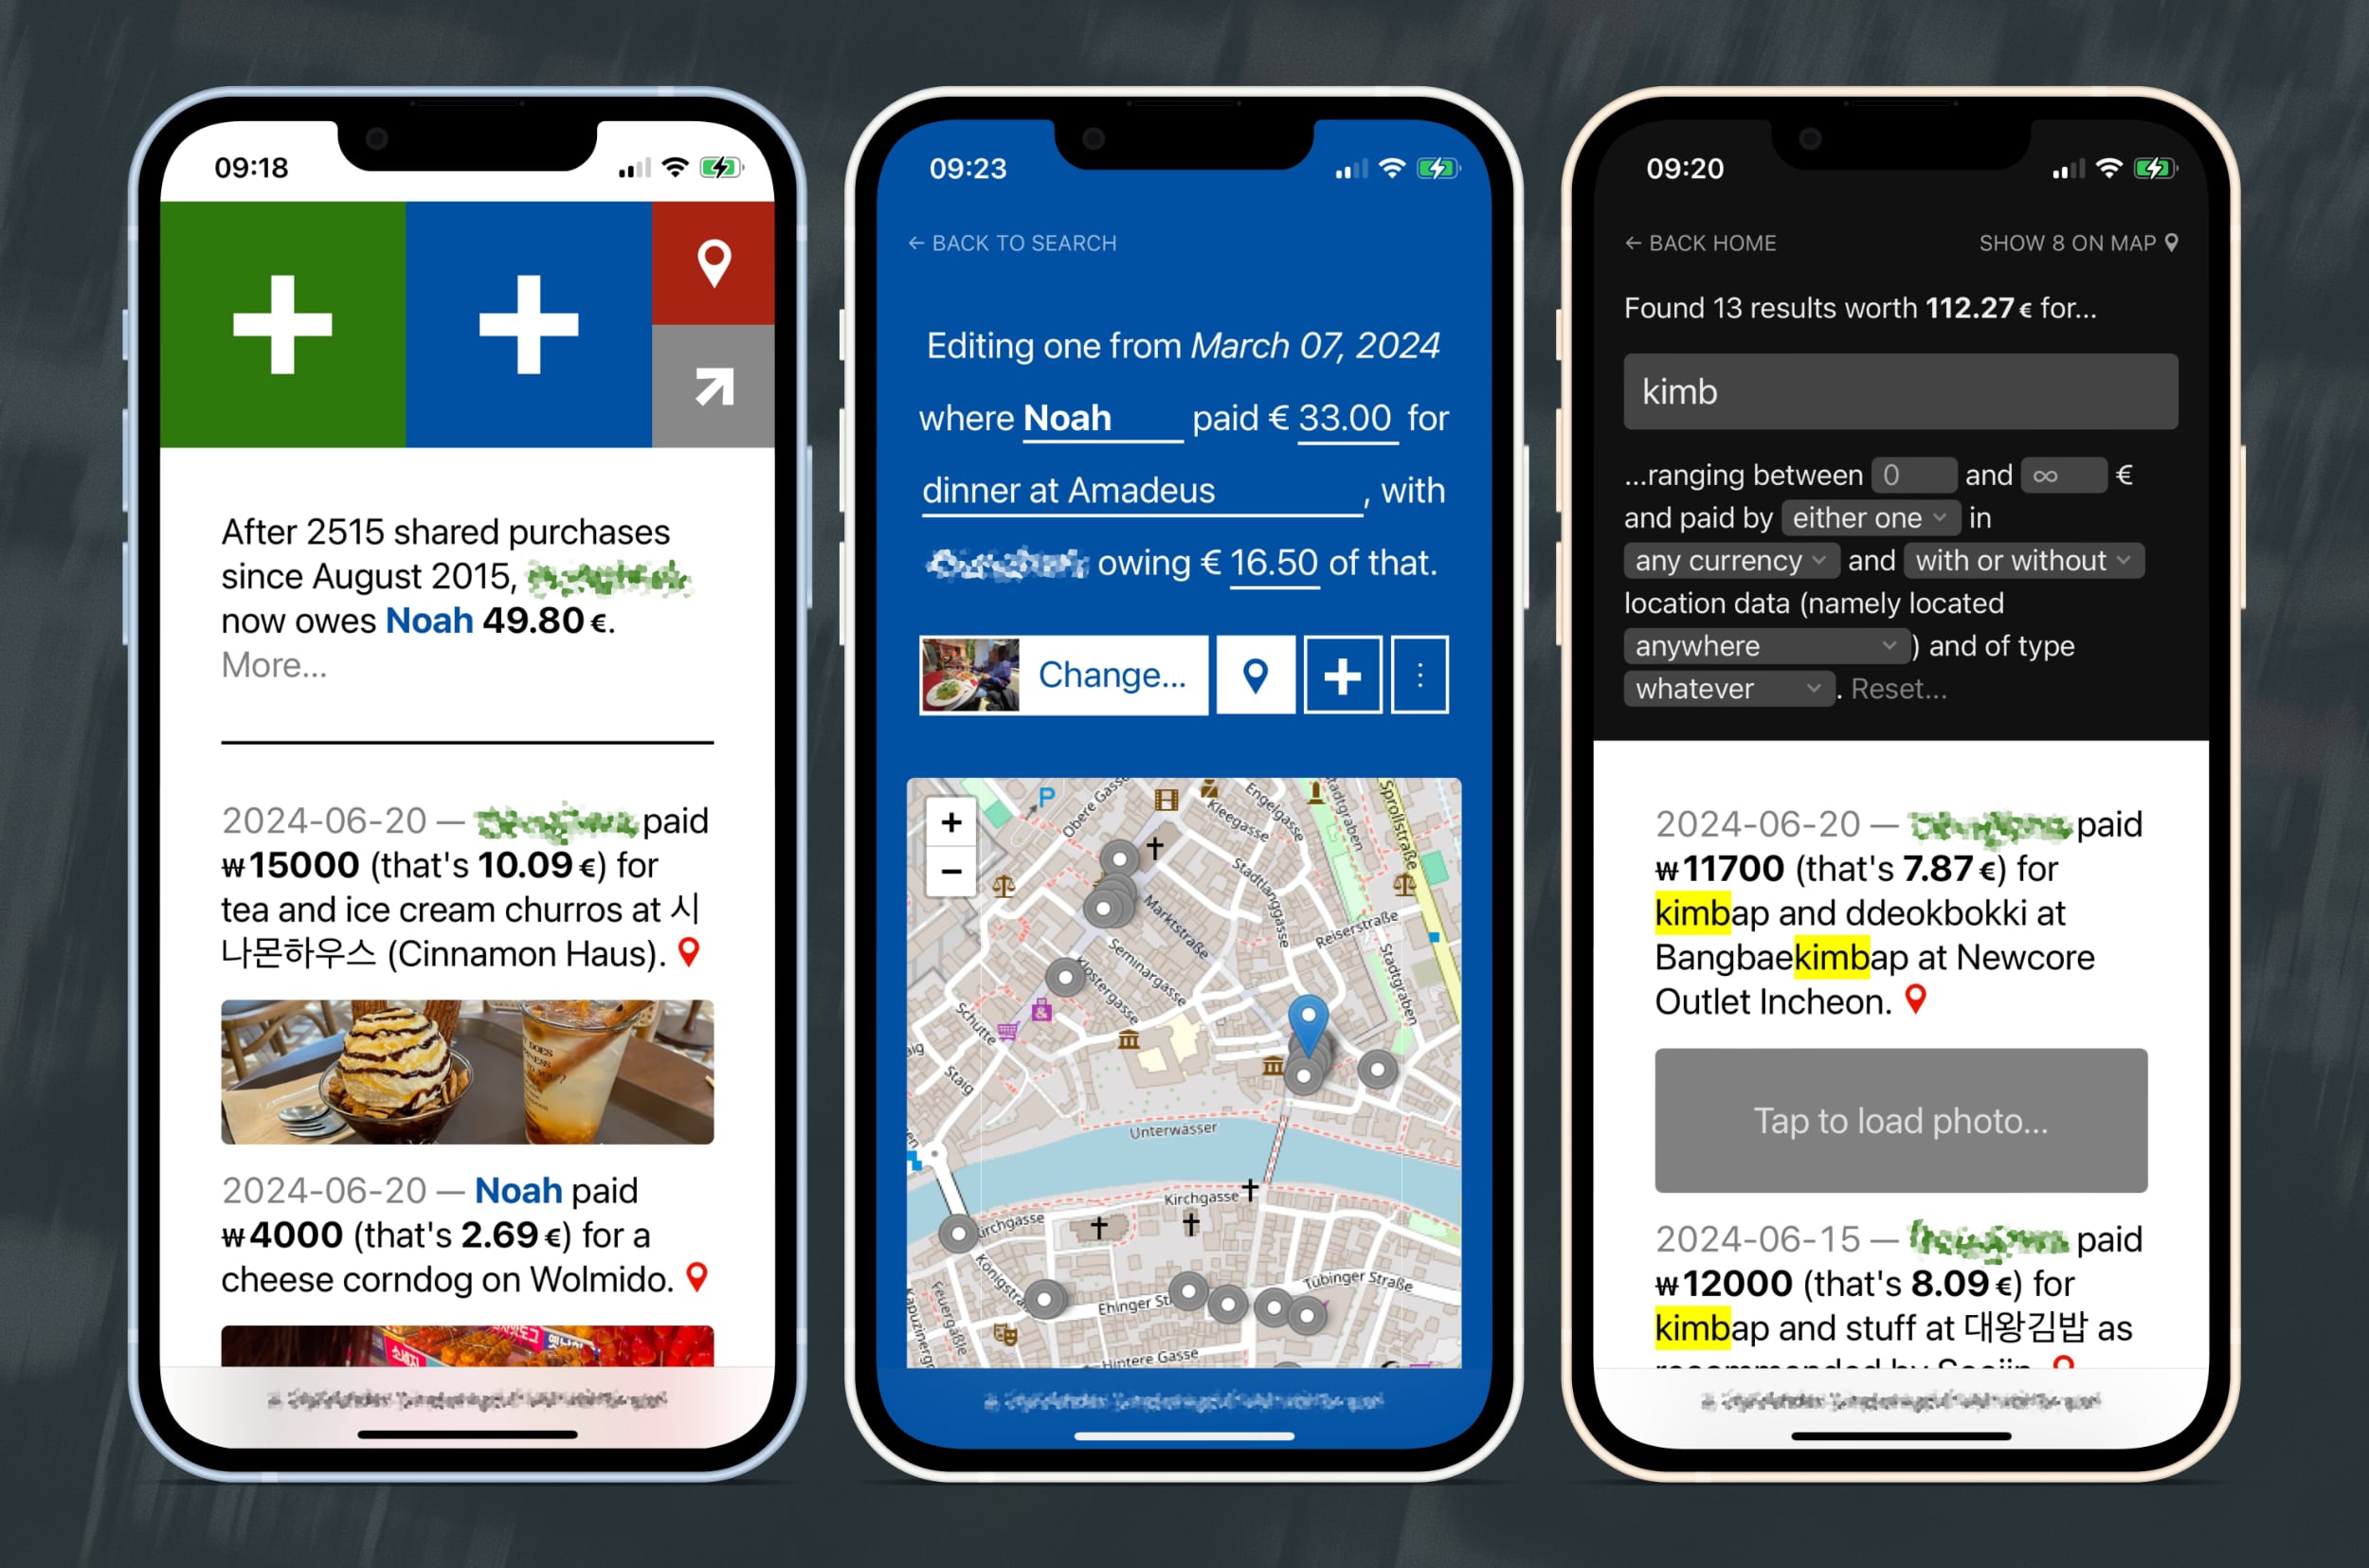
That's Korean for "MoneyMoneyMoney", which seems appropriate enough for this web application I built in 2015 for my partner and me to track our shared purchases with. It's not open source because it's largely written in a somewhat gruesome me-in-2015 dialect of PHP – having said that, it's been working well enough to never really warrant a rewrite.
In 2024, along with location support, I finally added edit and search functions, the latter of which I wrote a blog post about.
Three screens: the main list of purchases, an edit form, and the search page. There's also a map view and a statistics page, but they're not all that interesting to look at.
No, this isn't some amazing text-recognition machine learning framework for mathematics – it's much more mundane: A JavaScript-based UnicodeMath to MathML translator that integrates with Markdeep to make UnicodeMath immediately usable in day-to-day document authoring. What's more, it's trivial to deploy UnicodeMathML in arbitrary websites (along with MathJax for rendering) or even server-side with Node.js.
UnicodeMath is an easy-to-read linear format for mathematics initially developed as an input method and interchange representation for Microsoft Office. It relies on Unicode symbols like ∮ taking the place of control words like \oint, improving plaintext readability over notations like (La)TeX. Its author, Murray Sargent III, has published a Unicode Technical Note detailing the format, based on which this translator was built.
The initial development of UnicodeMathML was part of my Master's thesis.
The UnicodeMathML Playground, originally built as a development tool, along with two well-known formulas expressed in UnicodeMath. Get familiar with it here!
Whilst working on ærialbot, I realized that Google Maps regularly updates the satellite imagery it serves its users, but outdated versions of the imagery are kept around for a year or two. To explore this semi-hidden historical data, I've developed this Python-based command-line tool that crawls its way through these versions, figuring out which provide unique imagery for a user-defined area and eventually assembling it in the form of a GIF.
Here's how Heathrow Airport has appeared on Google Maps between circa early 2020 and mid-2021.
Several Markdeep-based "Office Applications"2019–2021
Morgan McGuire's Markdeep is a JavaScript library that, when included at the bottom of a Markdown file, automatically converts it into HTML when the file is opened it in a web browser. Primarily for the purposes of writing and presenting my Master's thesis, I've built several browser-based tools that postprocess Markdeep's output:
markdeep-slides splits a document into presentation slides, provides presentation controls via keyboard shortcuts, displays presenter notes, supports different themes, and offers PDF export.
markdeep-thesis utilizes Bindery to divide a Markdeep document into pages, with footnotes, a table of contents with page numbers and other affordances. It provides an opinionated stylesheet for (under)graduate theses based on my own Master's thesis.
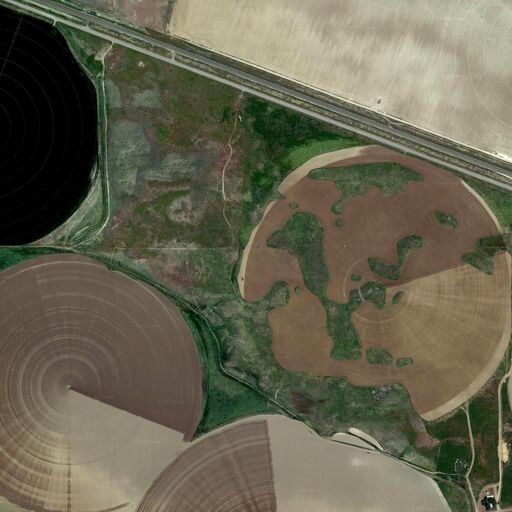
Having previously built a tool for downloading aerial imagery in the form of ærialbot, I found myself drawn to depictions of center pivot irrigation – a method of efficiently watering crops that invariably produces large circles visible on satellite maps. Intending to produce a series of videos, I required some tooling for swiftly and precisely cropping center pivot irrigation fields from aerial imagery, with predefined margins and while keeping associated geotags intact.
Crop Circles is a purely-client-side web app that does exactly what I wanted while being highly configurable, user-friendly, fast, and robust – all selections made by the user are persisted in local storage across reloads (and can be exported and imported) to reduce the chance of data loss. But stop reading and try it out here – I've taken care not to limit it only to my use case!
The UI of Crop Circles. The sidebar can be scrolled, revealing many knobs and toggles. The interface element in the bottom right helps with precise alignment of the current selection.
A basic video composed of images cropped with this tool.
I happen to read a bunch online. Unhappy with aspects of existing read-it-later offerings like Instapaper and Pocket, I wrote my own PHP-based tool for keeping a reading list, maintaining a searchable archive along with a list of favorites, and analyzing when, what, and how much I've read in a given time period – one insight, for example, was that the number of articles read per day follows an exponential distribution.
It's been in continuous use since 2013 and I've logged more than 20,000 articles so far while extending it to cover my varying use cases throughout the years.
The list of unread articles ReAD presents upon initial load, shown here in a desktop browser. Because I hadn't been diligent about clearing out old stuff from my unread queue at the time the screenshot was taken, a reading suggestion is shown at the top.
ReAD on mobile devices – of course there's a dark mode.
For a while, I'd been happily using the Apple Maps widget on my phone's homescreen – but once I acquired a commute, its ML circuitry activated and cluttered the widget with incorrect and mistimed route estimates.
So after discovering Scriptable, I developed a widget that indicates the device's position on its homescreen using aerial imagery. Being based on ærialbot and a bunch of new ideas, the widget caches downloaded map tiles to limit cellular data usage, displays the latitude, longitude, and altitude, handles many kinds of errors gracefully, opens Google Maps when tapped, and is highly configurable.
A doctored image showing many differently-configured and differently-sized instances of the widget.
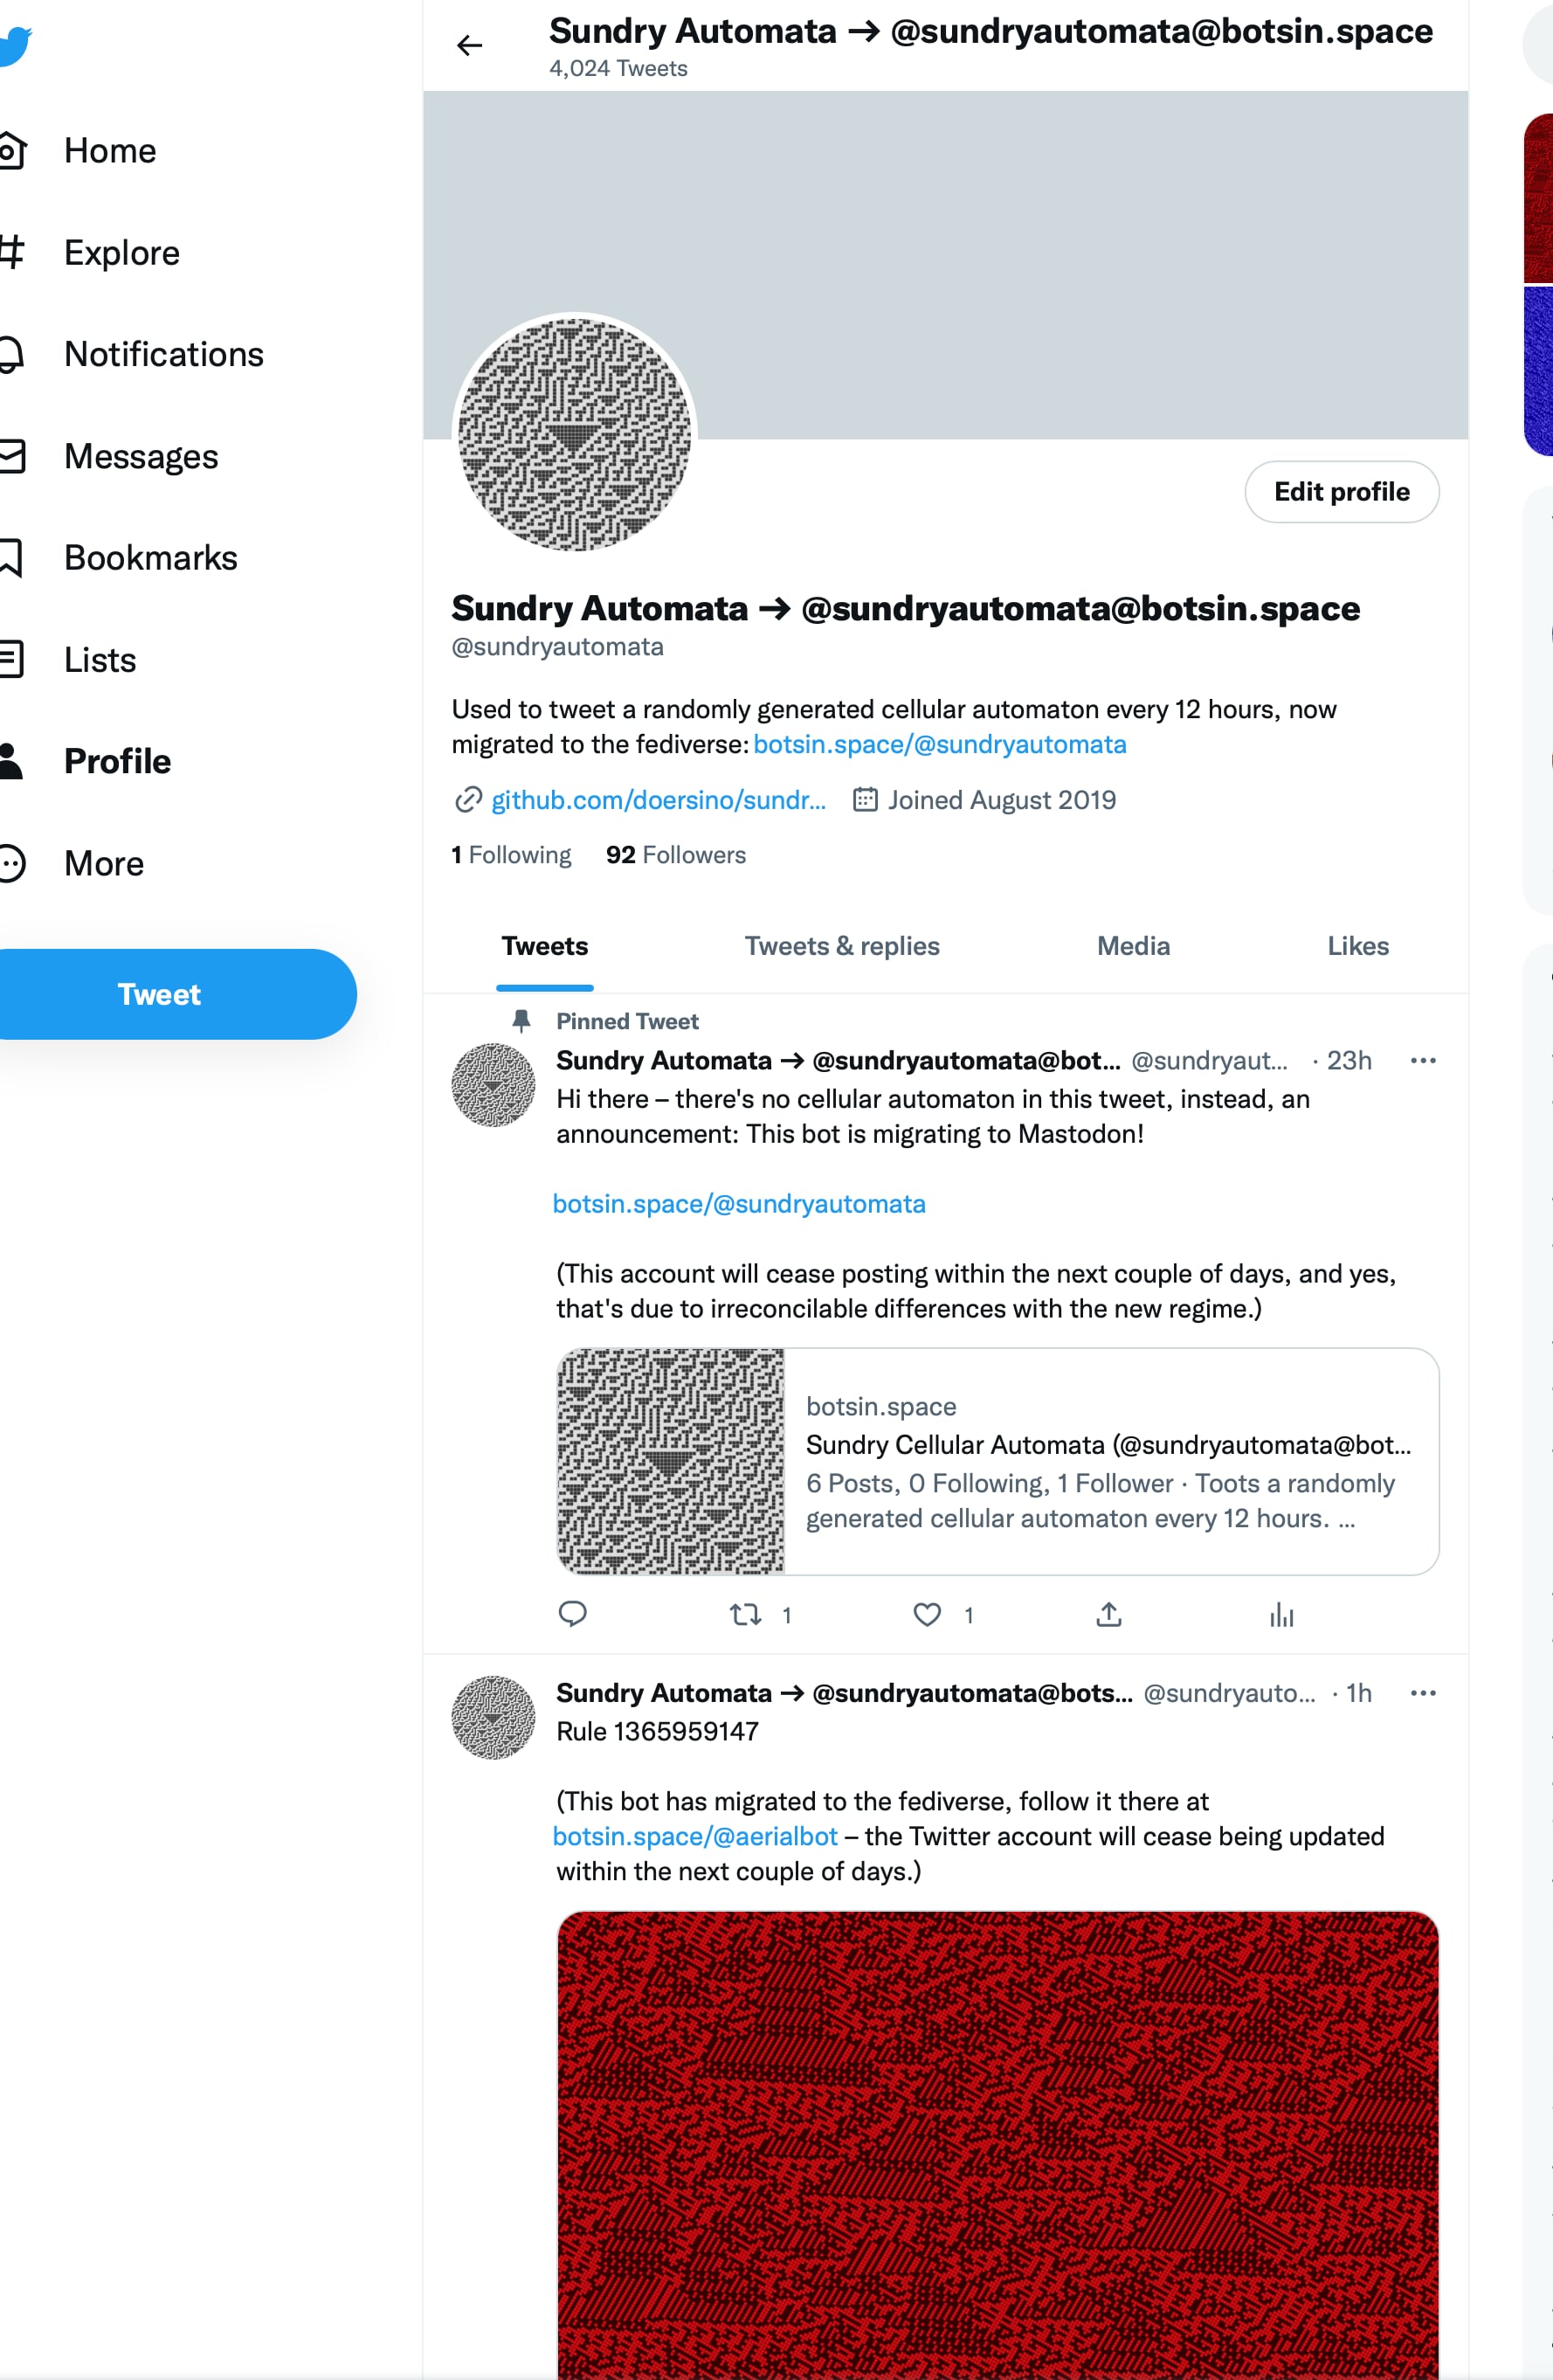
Stephen Wolfram's elementary cellular automata operate on a one-dimensional list of cells, computing future states of cells based on their neighboring cells. Drawing such states in order from top to bottom yields interesting patters, and with some color, they can make for attractive wall art. I wrote a Python script that, based on a design by Reddit user /u/collatz_conjecture, generates cellular automata posters as PDFs.
Later, I adapted this script to run a Mastodon bot (previously on Twitter) – a sample of its outputs is shown below.
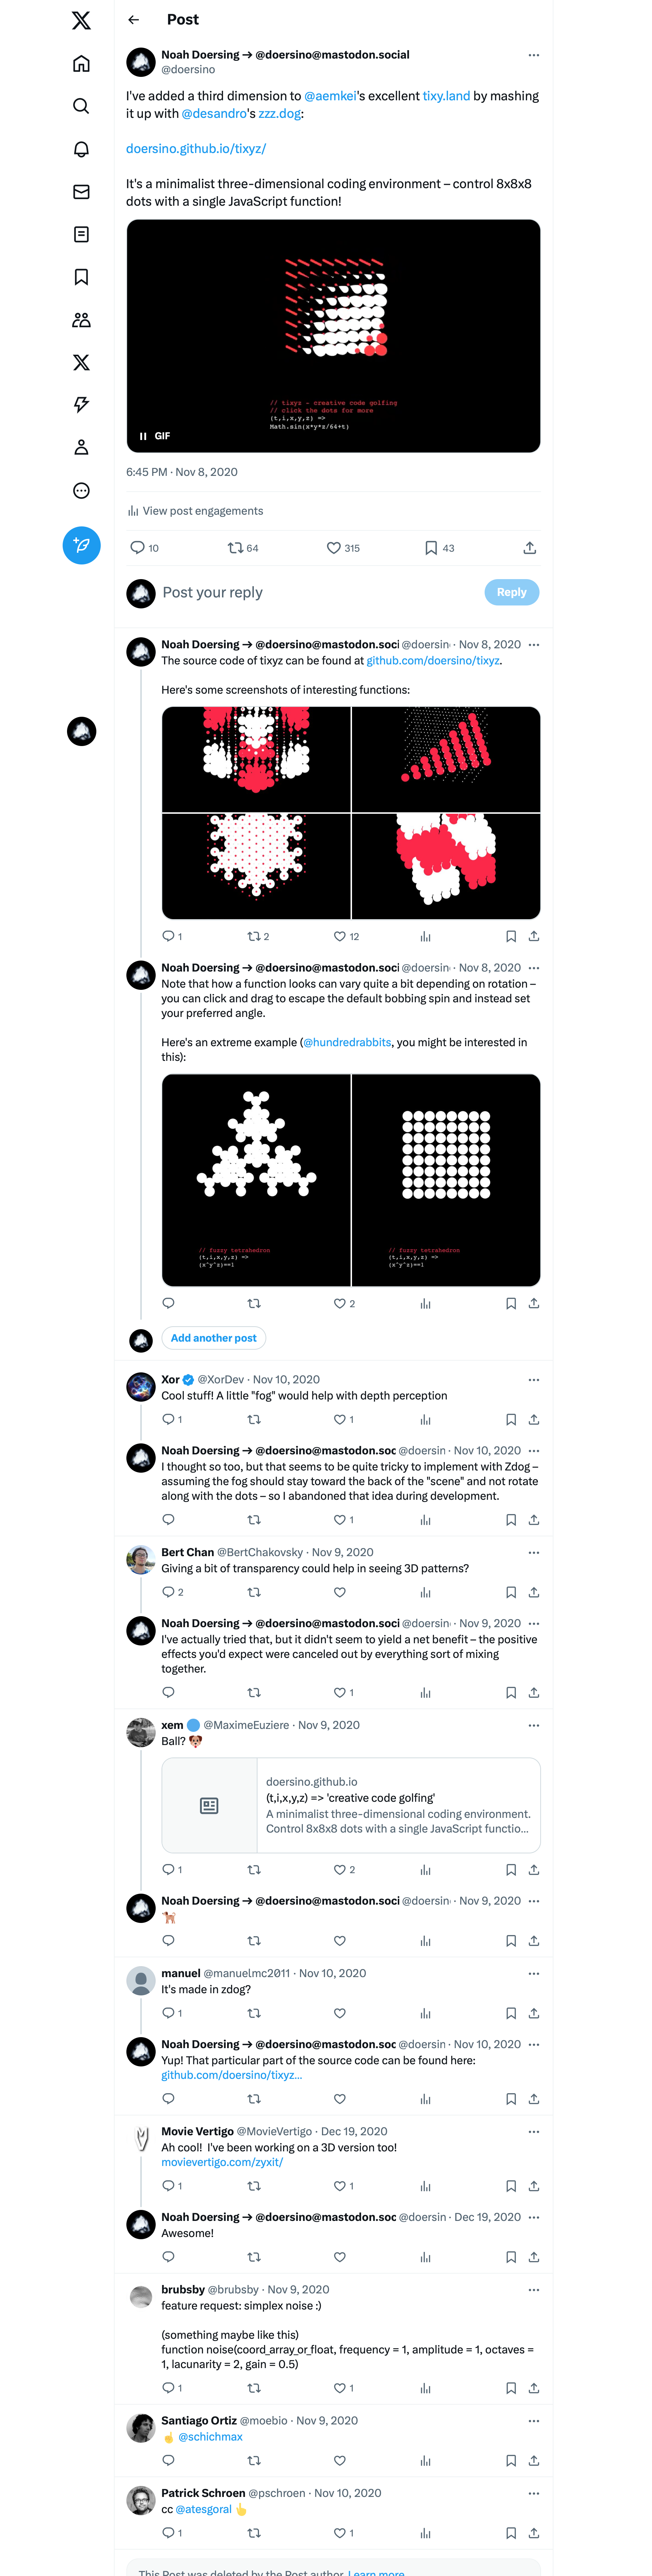
After coming across Martin Kleppe's excellent creative coding environment tixy.land, where you can animate a 16×16 grid of dots using a single JavaScript function, I had the idea of adding a third dimension by mashing it up with David DeSandro's equally-excellent pseudo-3D engine Zdog.
Modern implementations of SQL (with window functions and recursive CTEs) are Turing complete, enabling the formulation of arbitrary programs. To demonstrate this, I've implemented an admittedly-ancient handwriting algorithm in SQL. This work was done as part of Torsten Grust's SQL is a Programming Language seminar at Uni Tübingen.
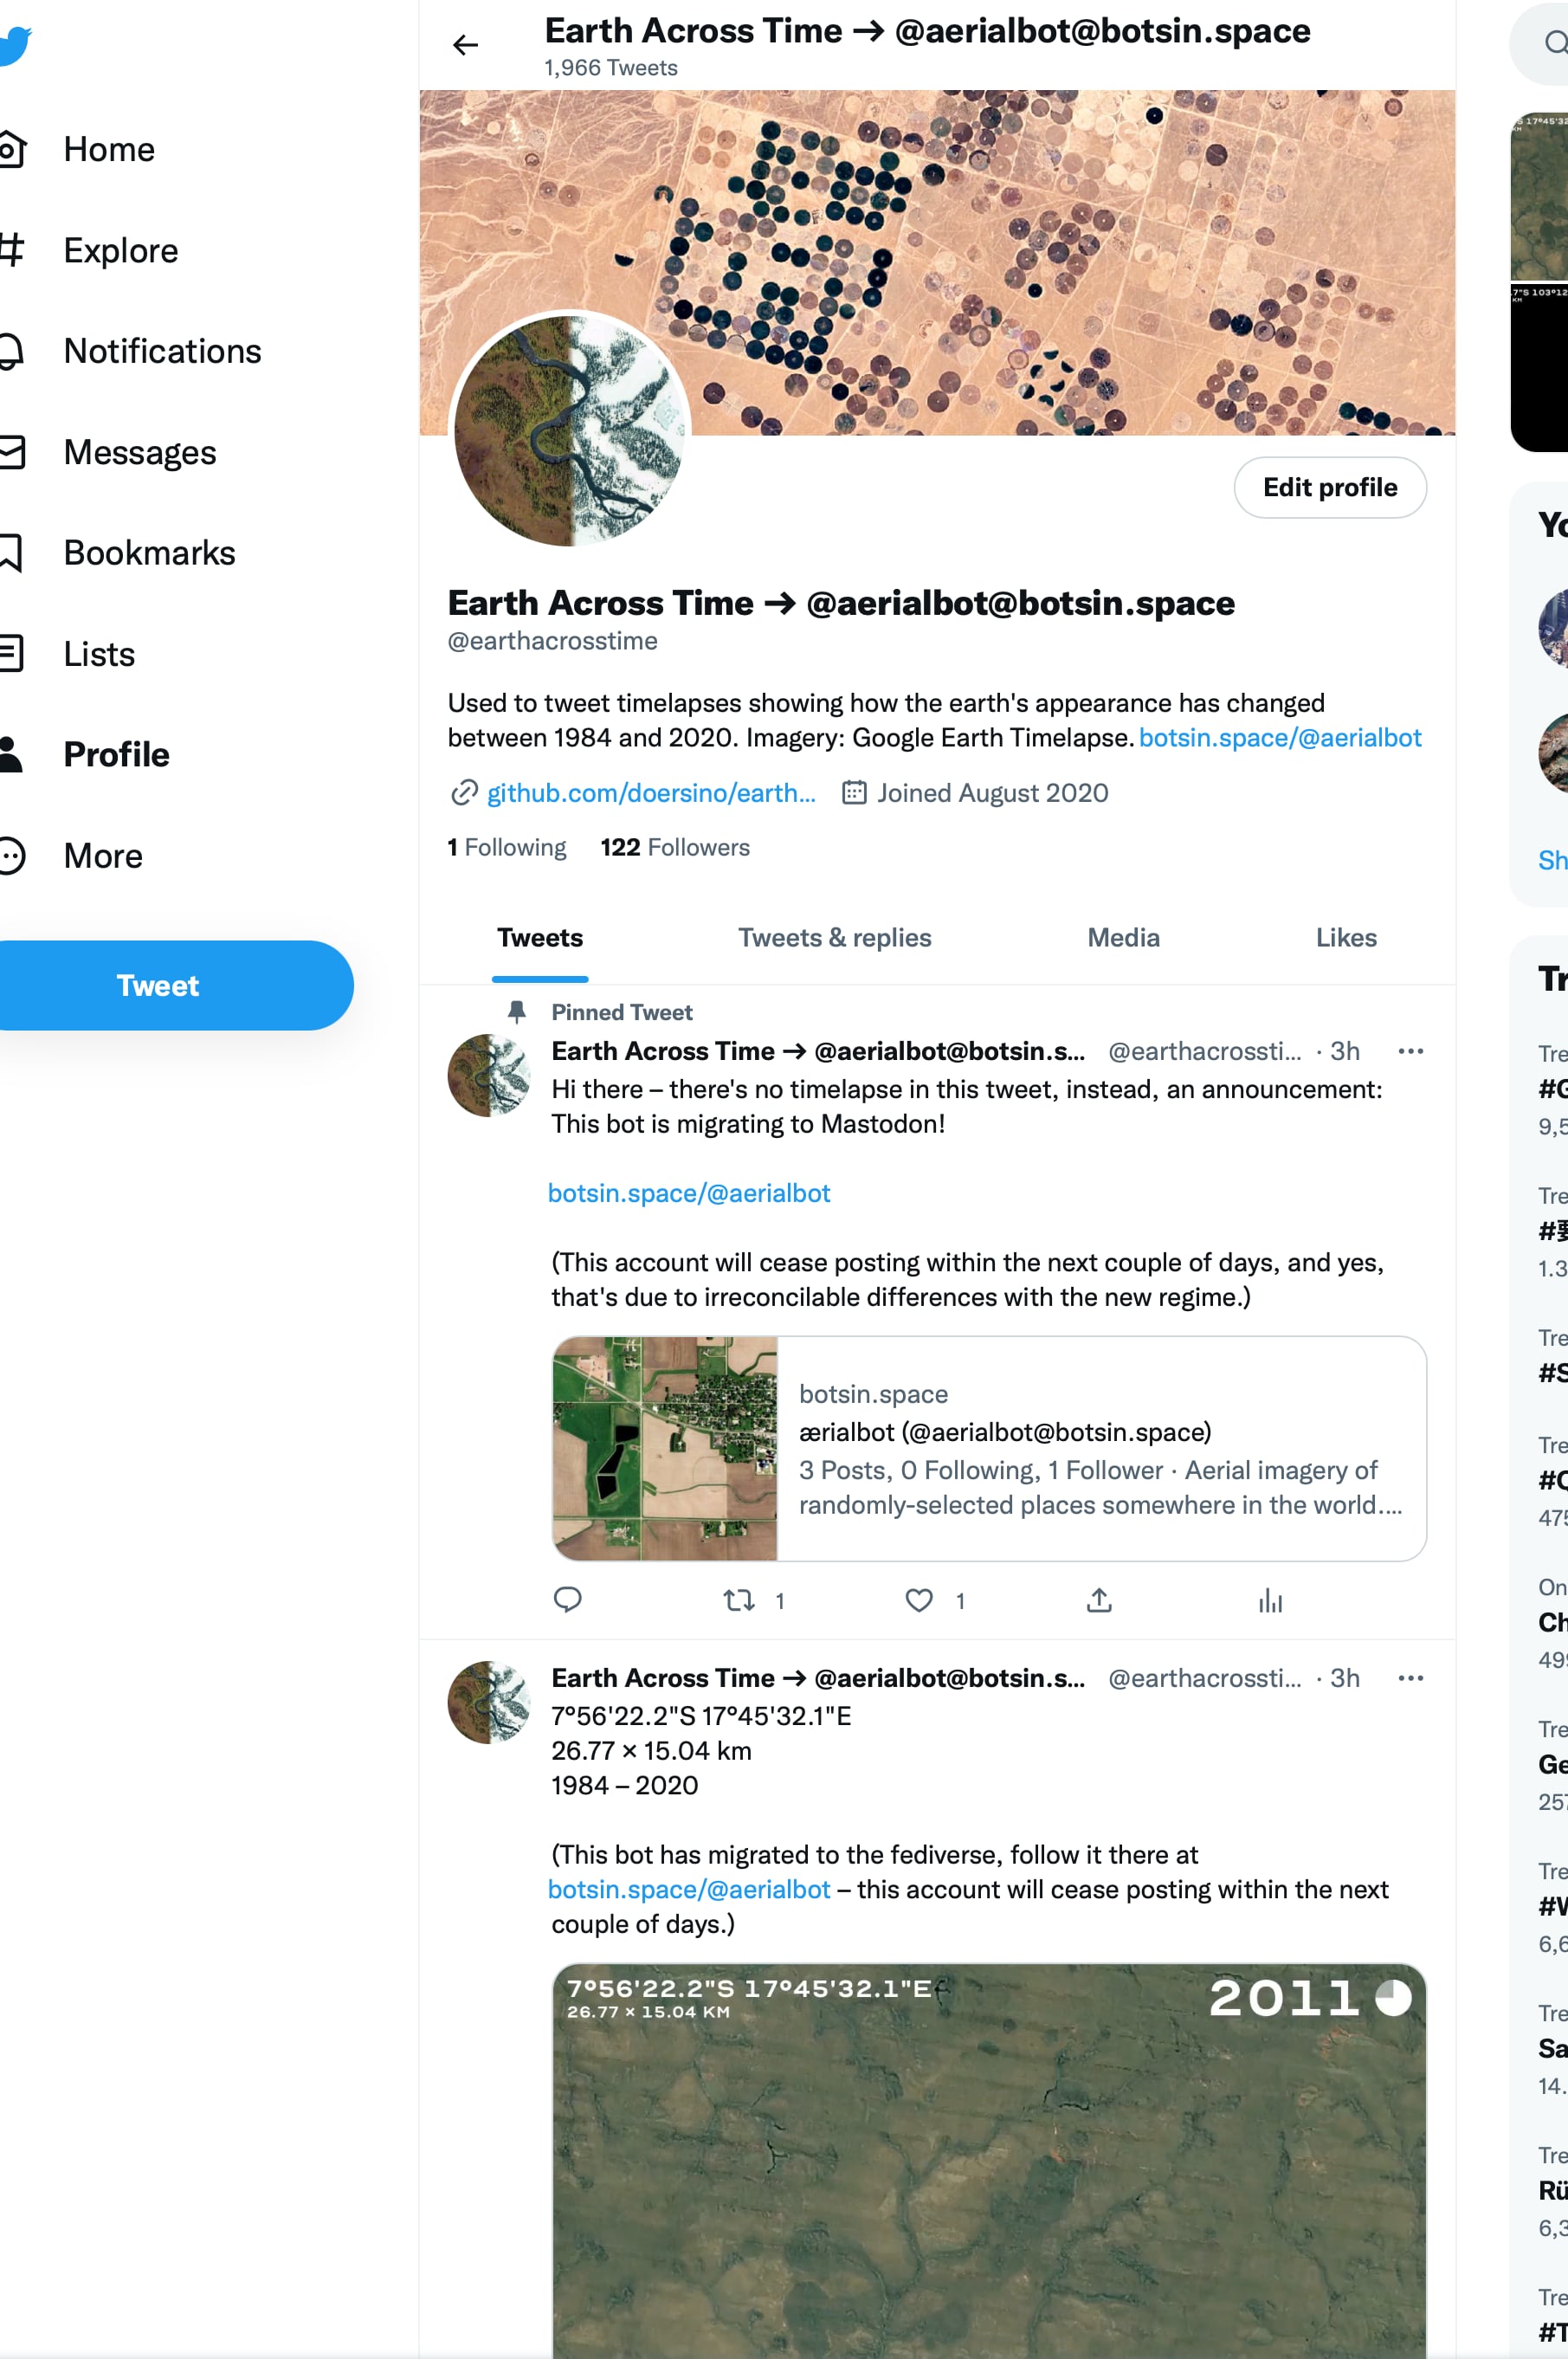
After coming across Google Earth Timelapse, a self-described "global, zoomable video that lets you see how the Earth has changed over the past 34 years" and having previously developed ærialbot (see further up), it seemed only logical to build @earthacrosstime – a Twitter bot that documents how randomly selected parts of the world have changed since 1984. (It's been migrated to Mastodon in late 2022.)
To this end, I had to reverse-engineer how to access the correct video tile for a given point. Dealing with some of MoviePy's intricacies in order to to automate adding annotations to the videos also took some puzzling.
An example video, documenting the construction of Incheon Airport.
The macOS variant of Apple's Photos app uses an unencrypted SQLite file as its metadata storage backend. Through reverse-engineering the structure of this database and the associated directory structure in which the photos themselves are located, I was able to write a Python script that exports a Photos library based on a set of conventions I prefer for my personal backups.
Until 2021, I used this tool for exporting photos taken with my iPhone, notably including the video components of live photos.
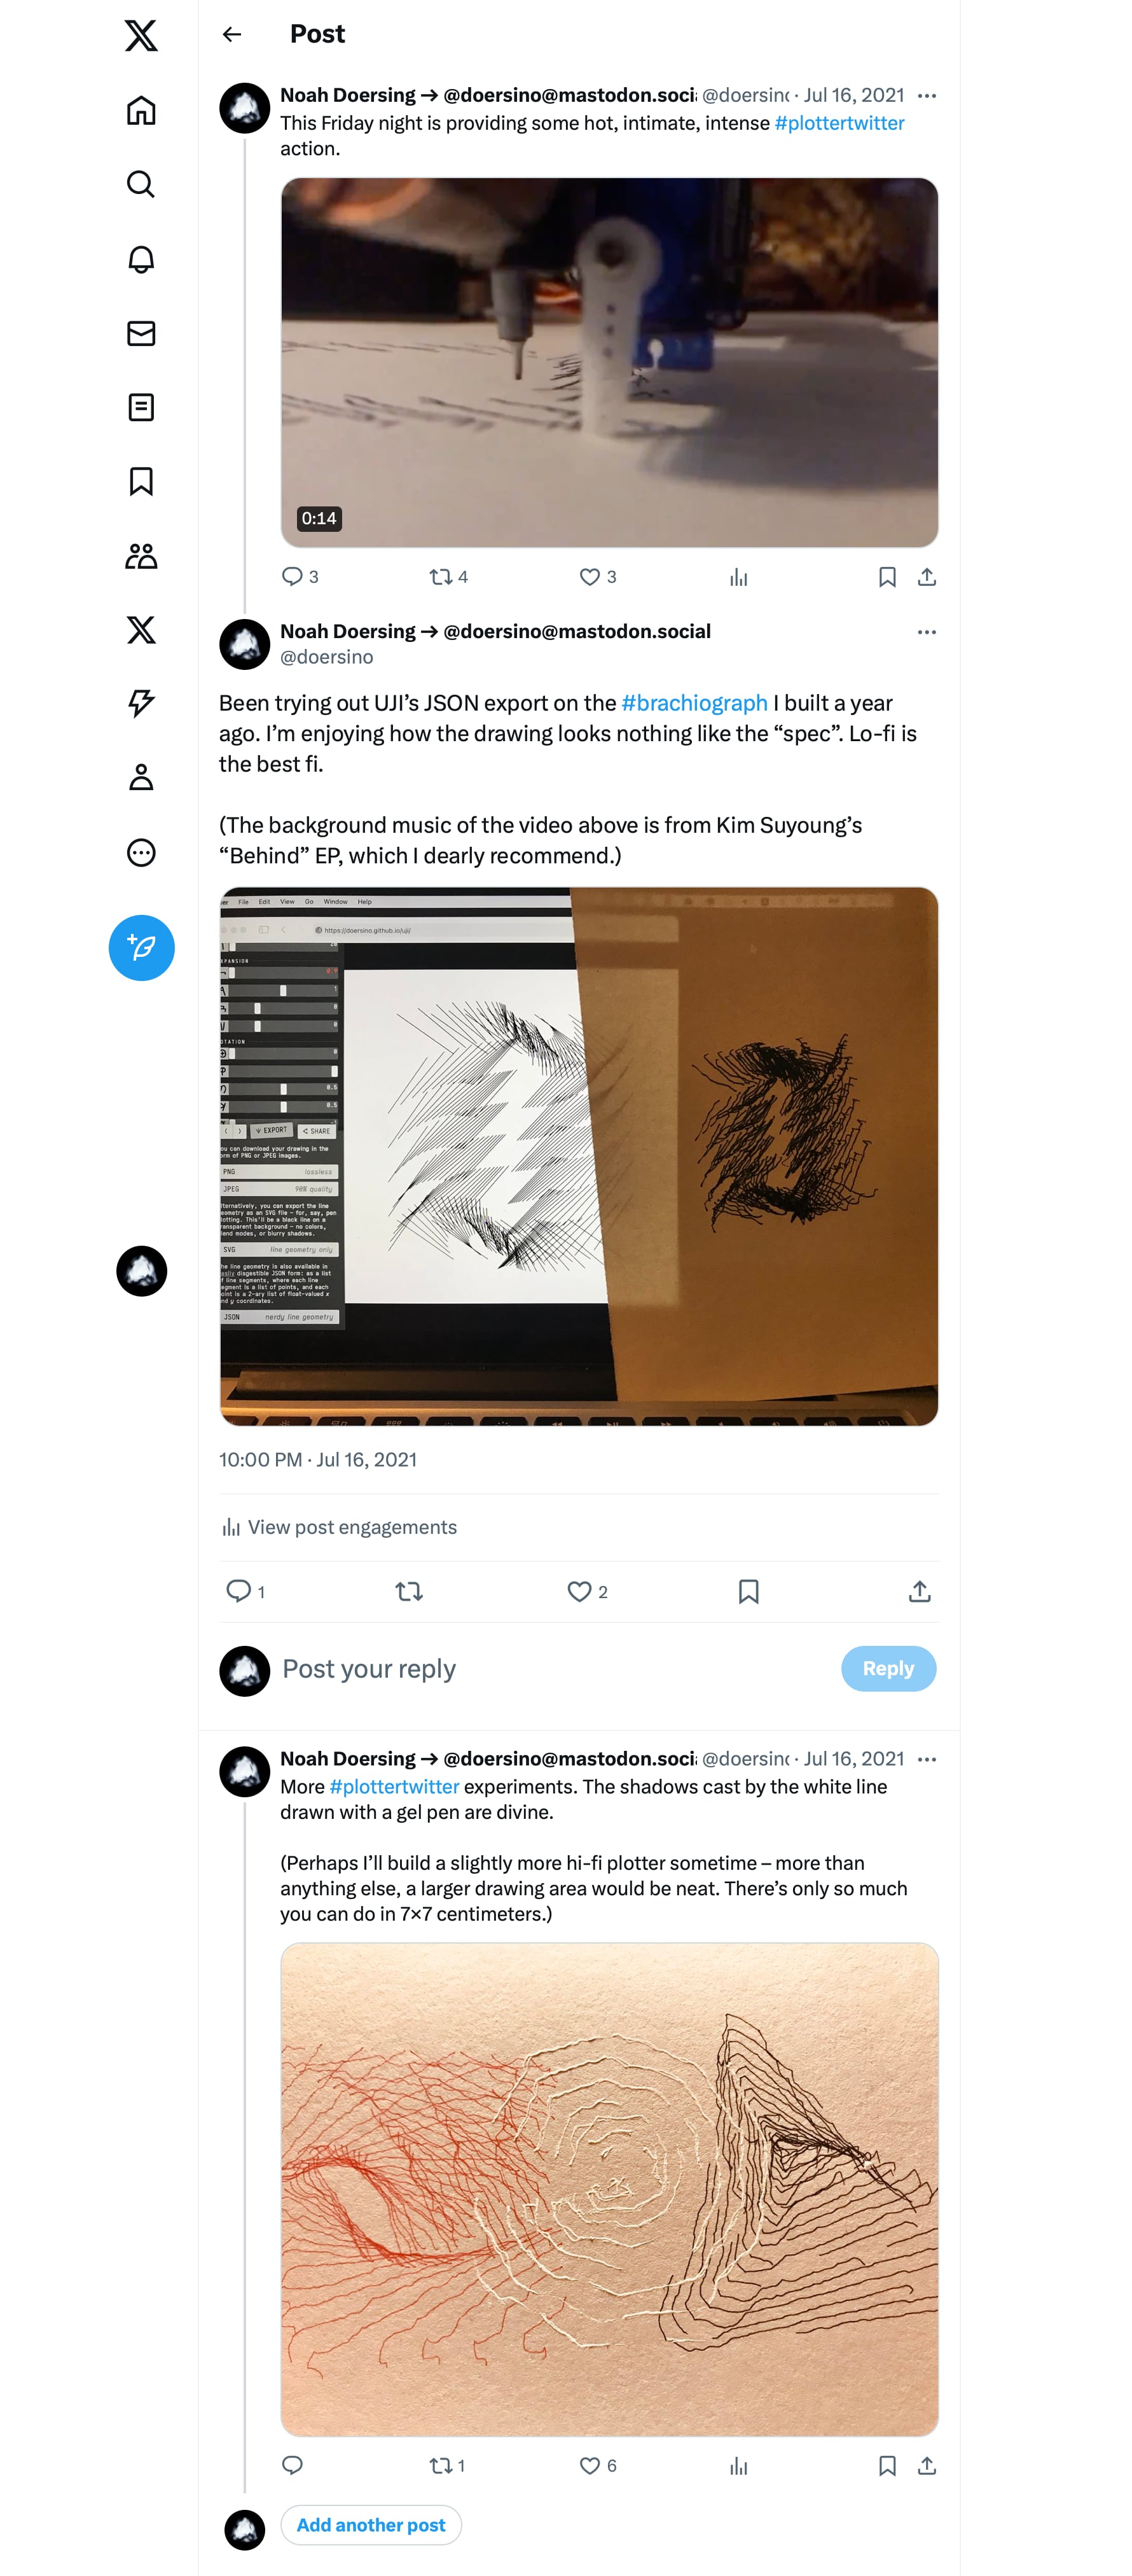
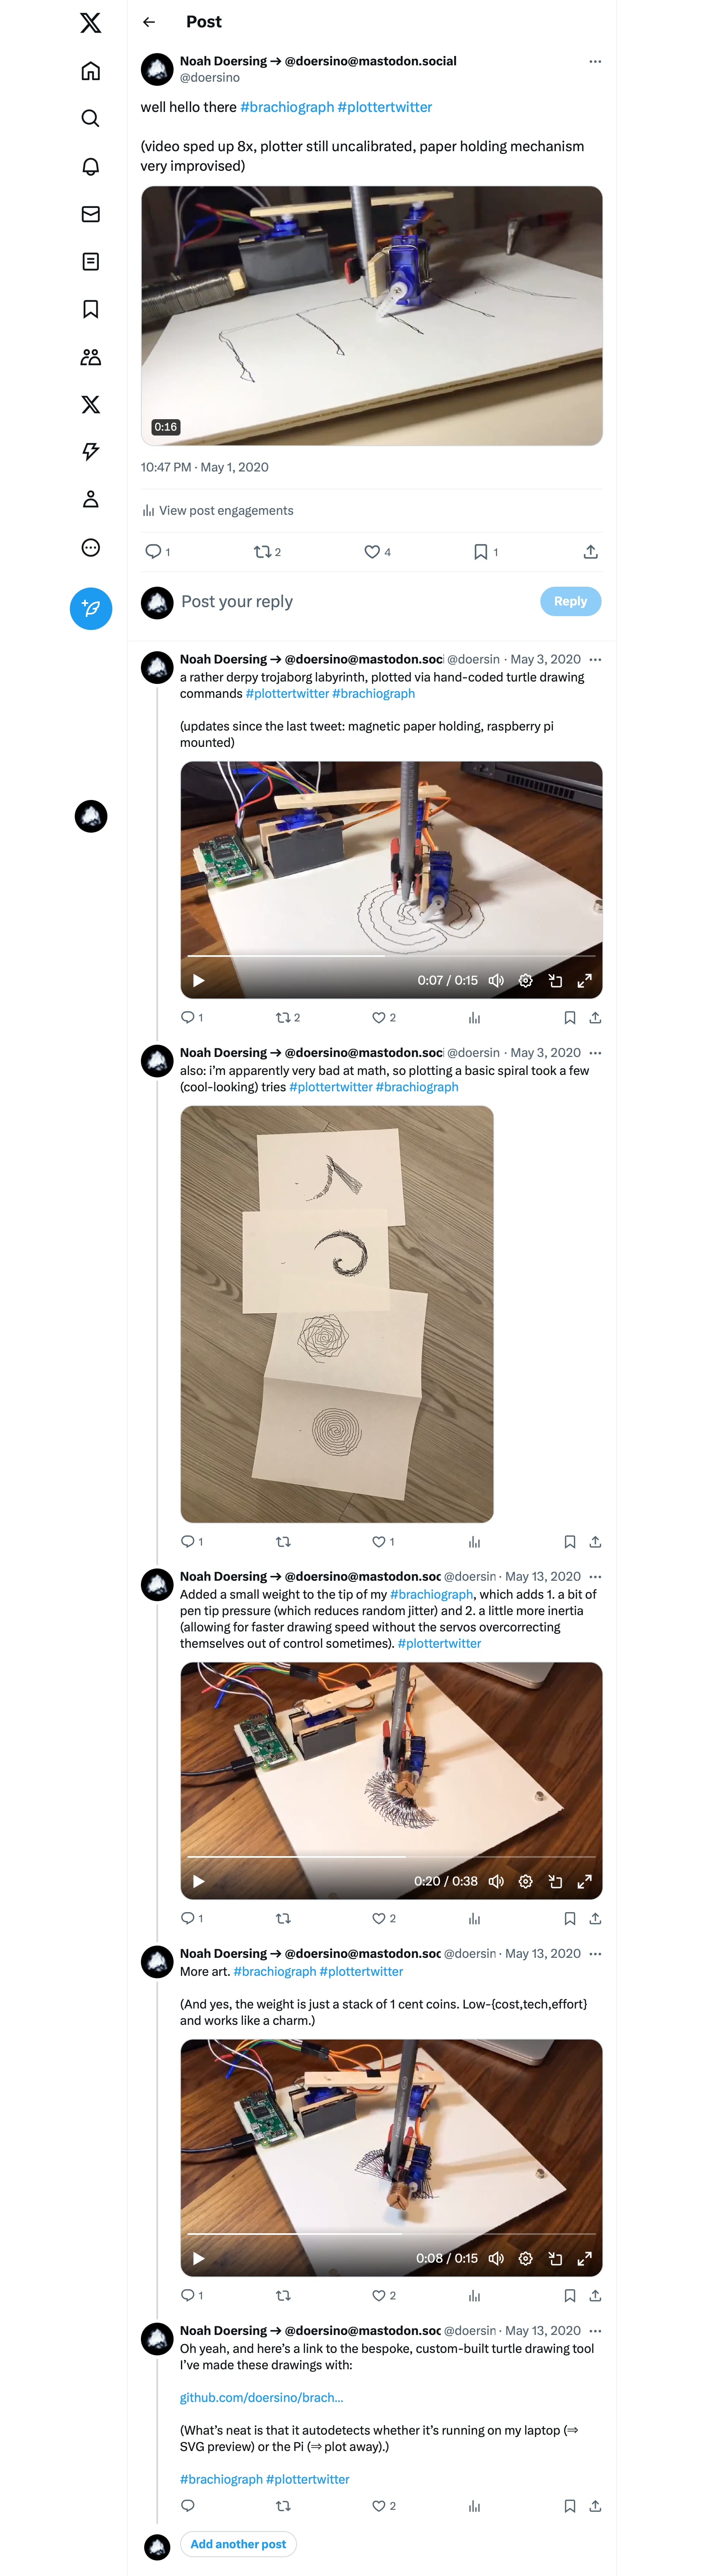
In early 2020, I've built myself a little BrachioGraph pen plotter. I'll readily admit that I haven't come up with the design nor devised the software that controls it, however I have written a basic turtle drawing program for it.
Dubbed Brachiosaurus, this Python-based command-line program 1. emits an SVG preview of the user-defined drawing if running on my laptop or 2. draws it on paper if running on the the Raspberry Pi driving the plotter. What's more, I've documented my escapades on Twitter.
A timelapse video of my BrachioGraph as it draws a piece of generative art specified with my Brachiosaurus tool.
In late 2021, I acquired an AxiDraw MiniKit 2 plotter, which allows for significantly higher precision than the BrachioGraph. To familiarize myself with it and push my creativity, I've participated in #GENUARY2022, a series of daily generative art prompts.
I intermittently run a local Minecraft server on an old laptop running Ubuntu. For this purpose, I've written a couple of bash scripts that start the server on system boot in a screen session for convenient remote management, keep an up-to-date incremental backup of the world and server files, as well as daily snapshots for nostalgia purposes, with old snapshots optionally being culled whenever disk space runs low.
Back in the early 2010s, when the microblogging platform Tumblr hadn't yet gone the way of MySpace, I designed and coded a few themes that users could install on their blogs through the integrated Theme Garden. Collectively, my themes have been installed on thousands of blogs over the years and are still in more-or-less active use on a few hundred.
Screenshots showing how some of the themes might appear – most of them feature customizable colors.
...and more!
The above is just a selection of stuff I've been working on recently or am especially proud of. You can find more, especially older projects and limited-scope utility scripts, on my GitHub account. Maybe there's something that will prove useful for you!
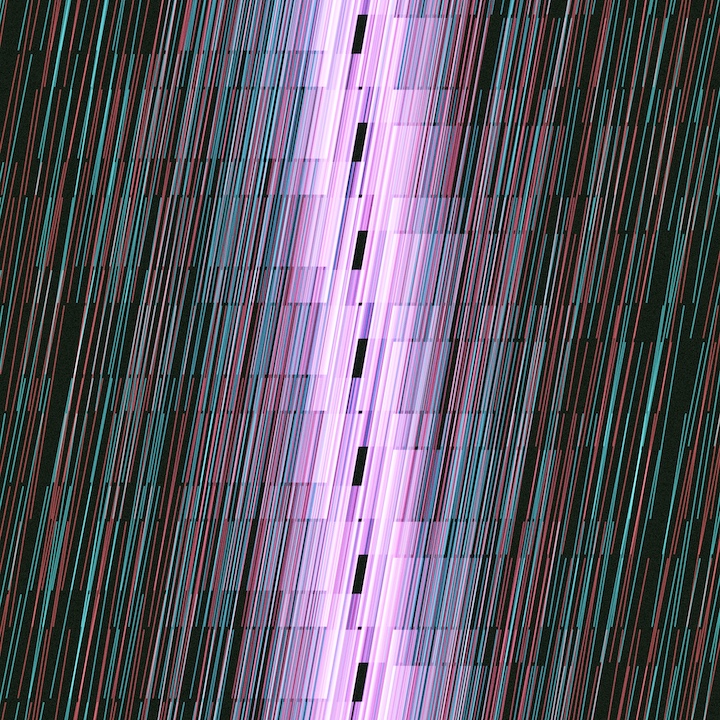
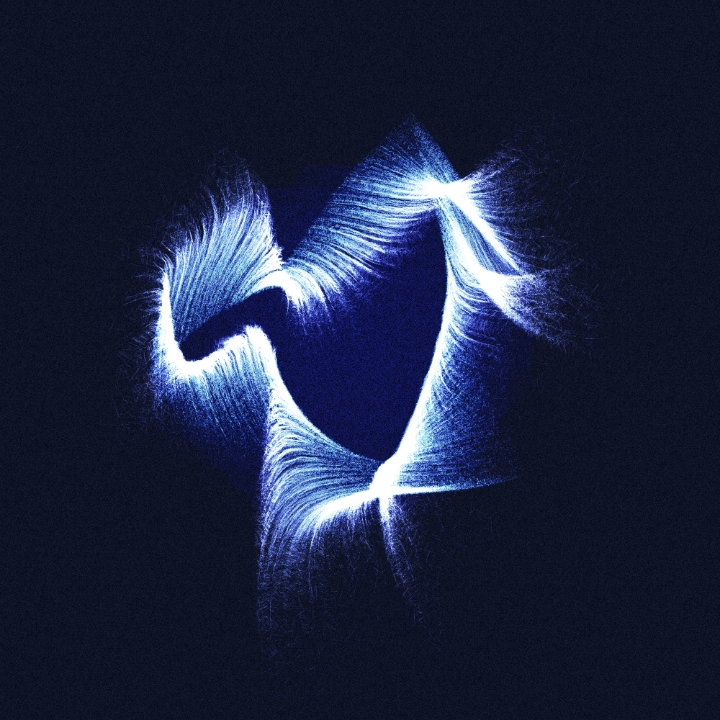
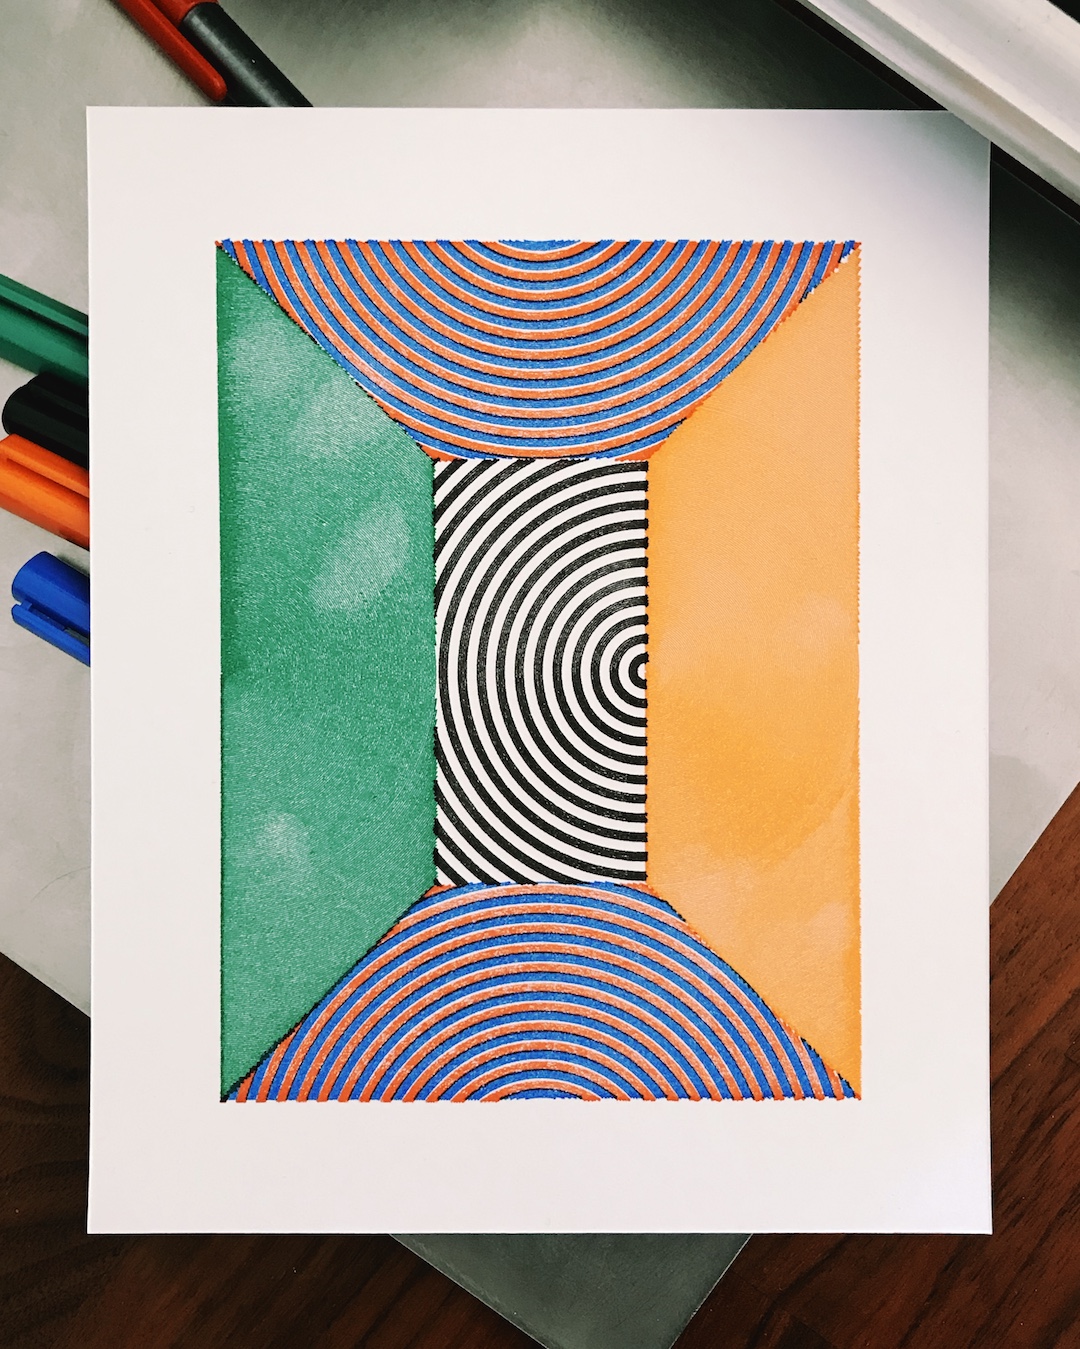
Generative Art
No artificial intelligence was harmed in the making of these images.
Here's a short selection of semi-recent pieces (which sounds way too snooty). I usually make this stuff in bursts – nothing for weeks, then, once inspiration strikes, a whole bunch in an evening. There's more over here!
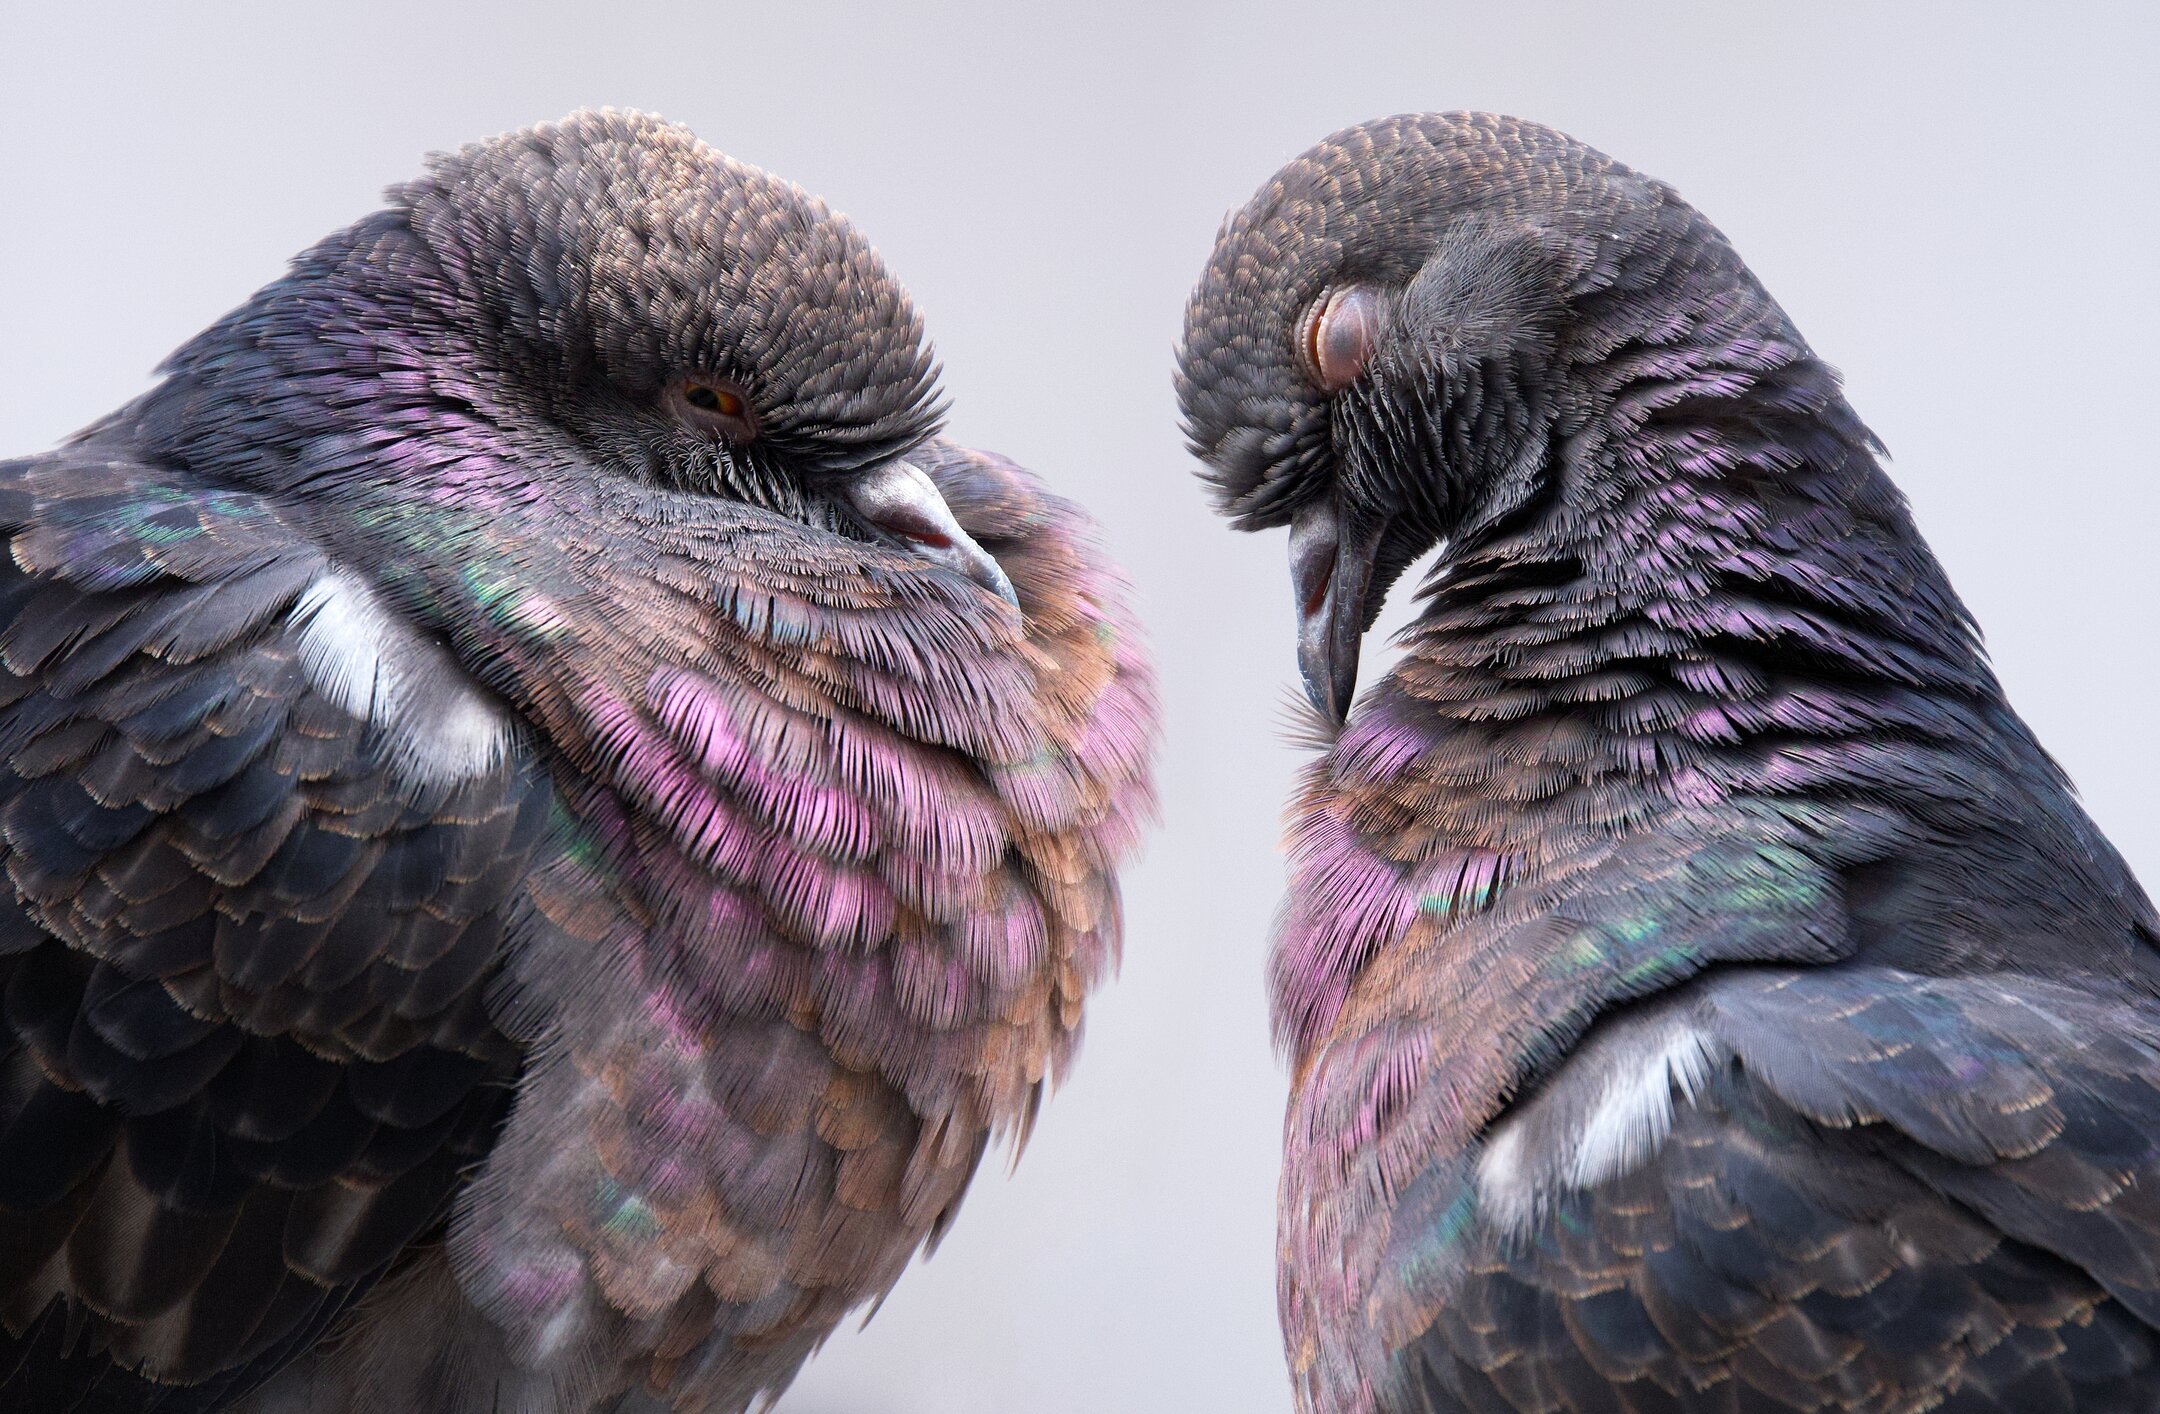
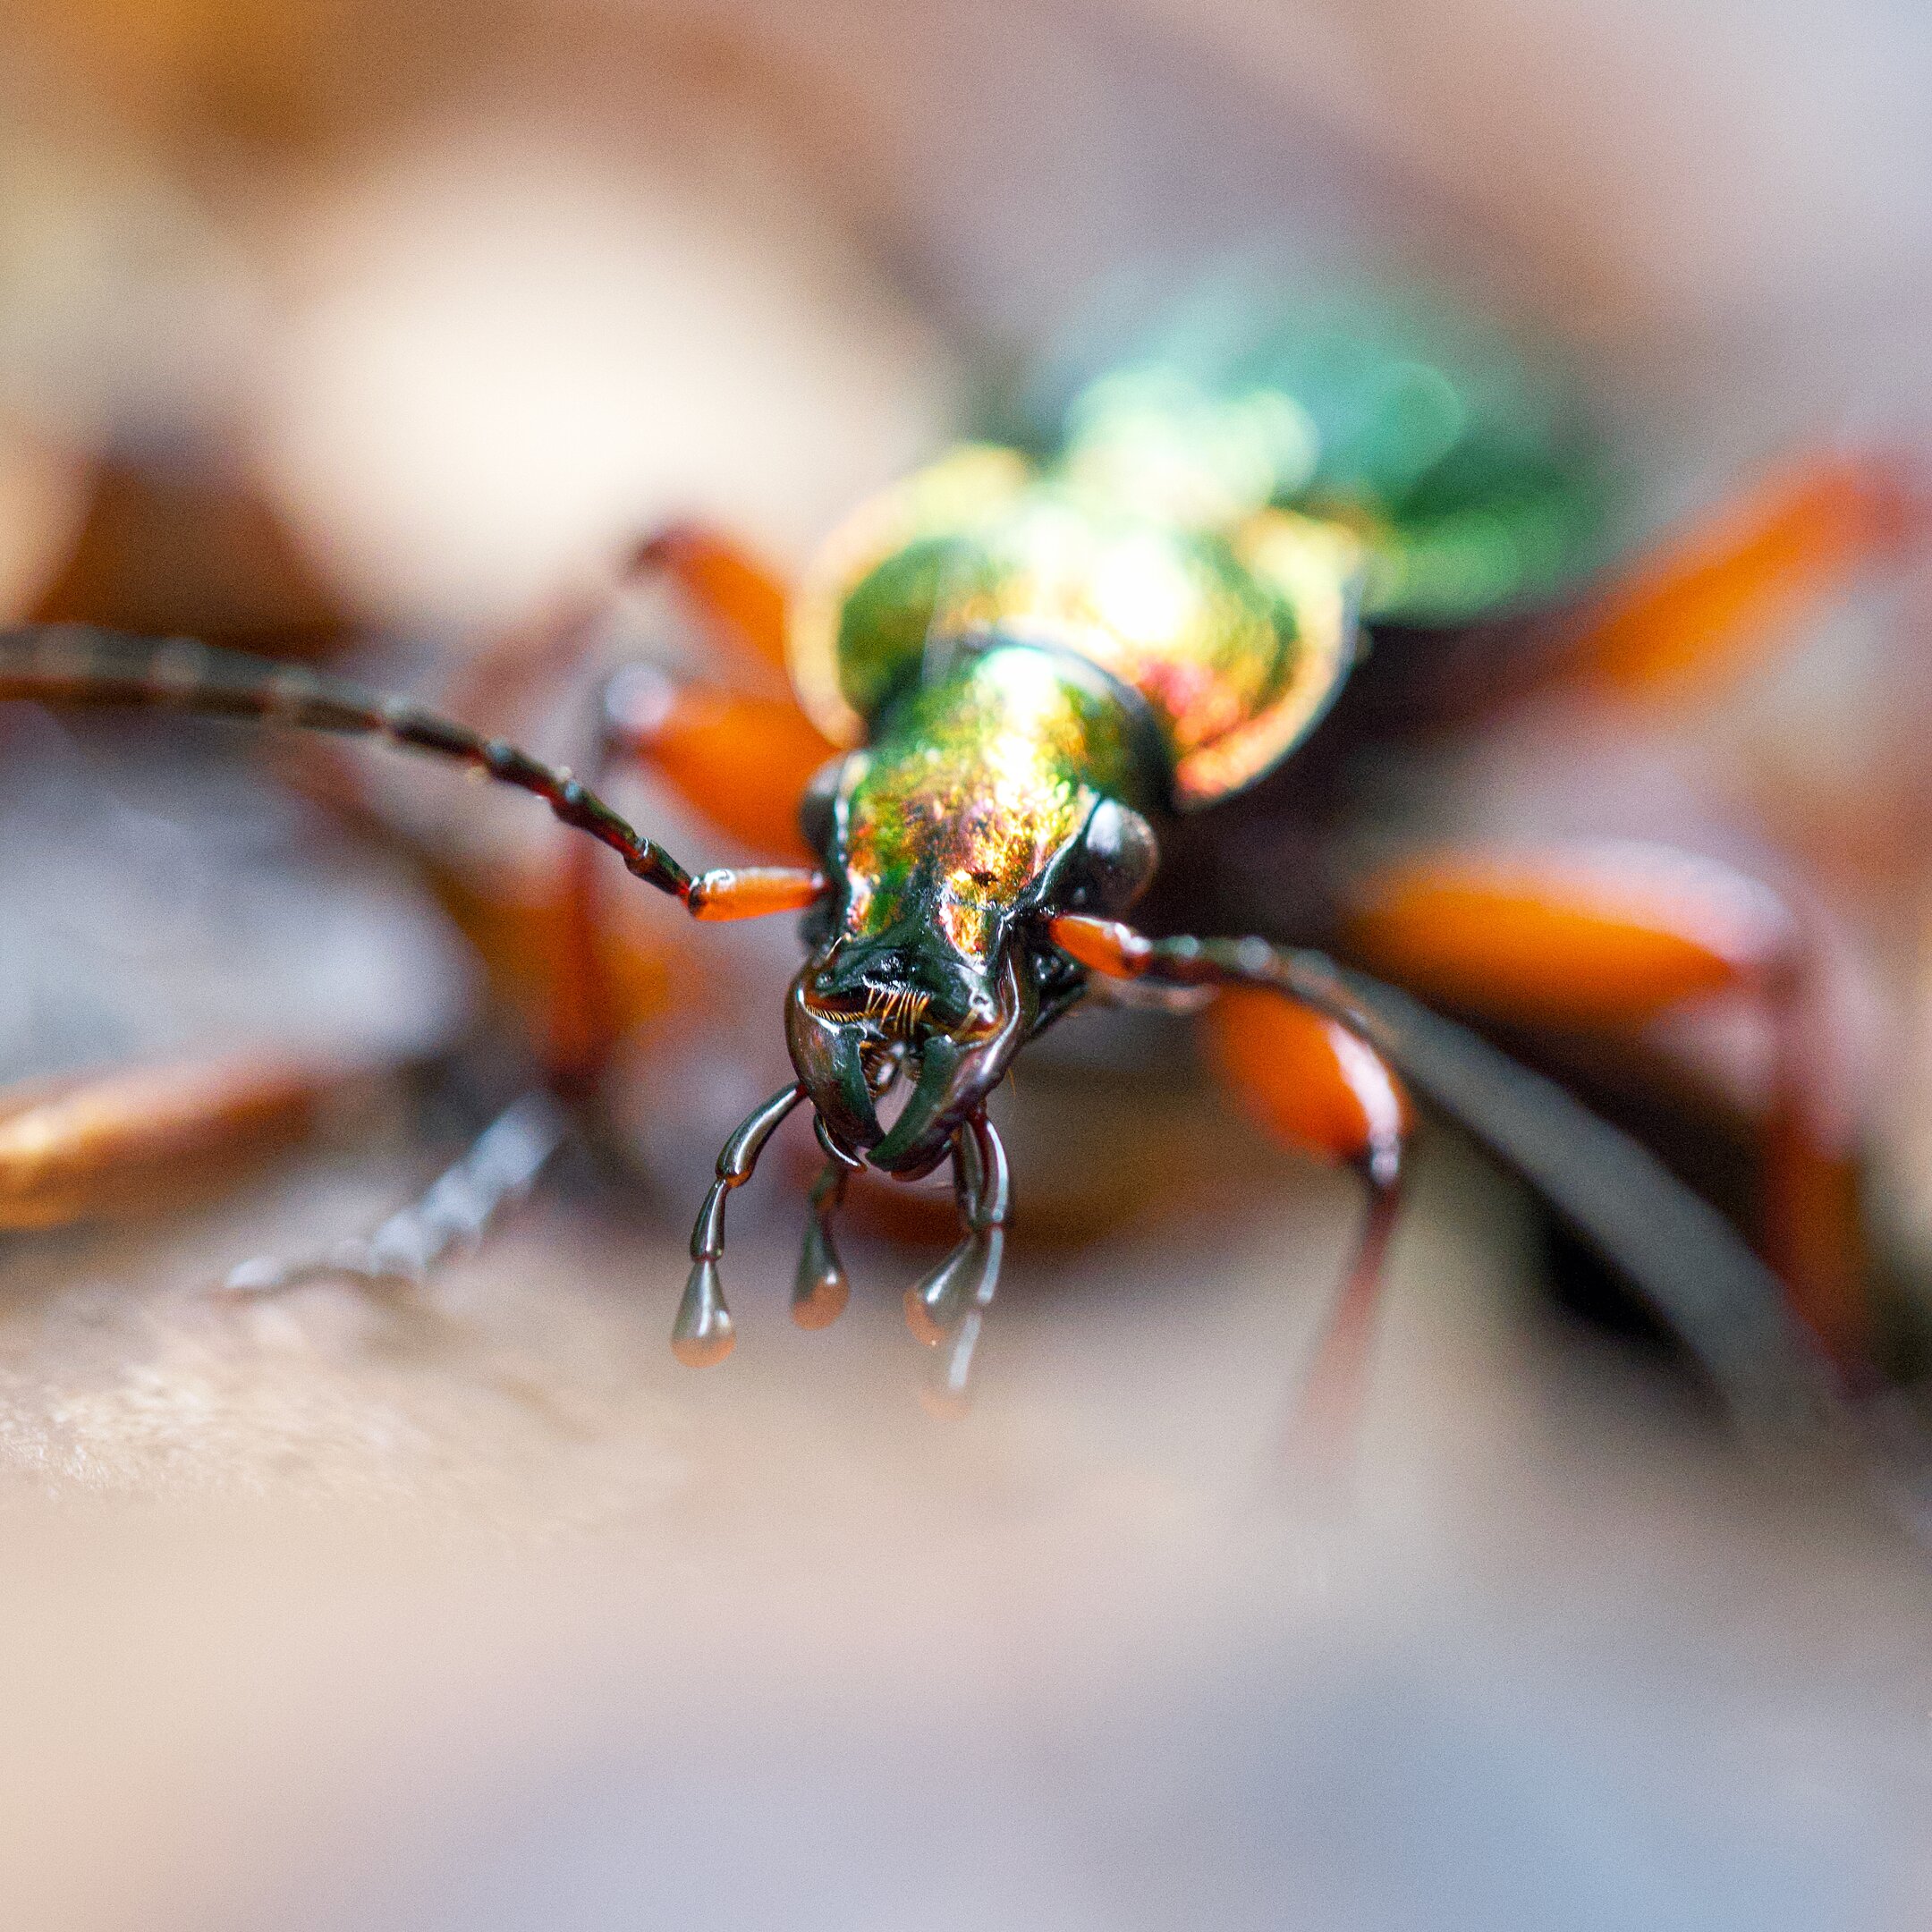
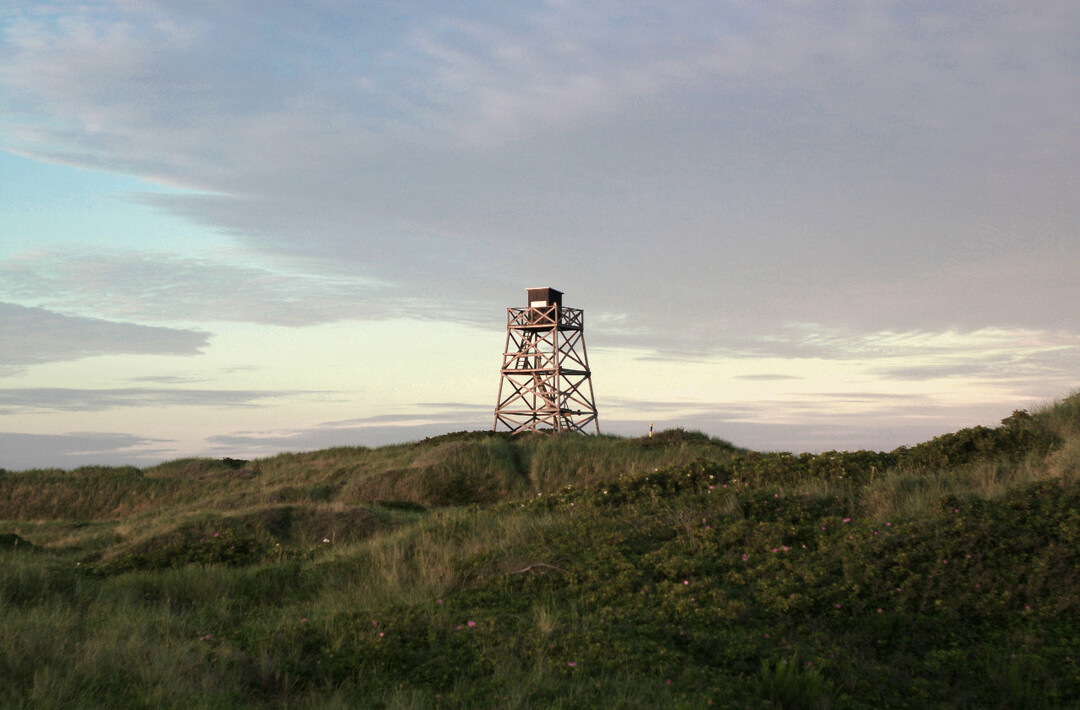
Photography
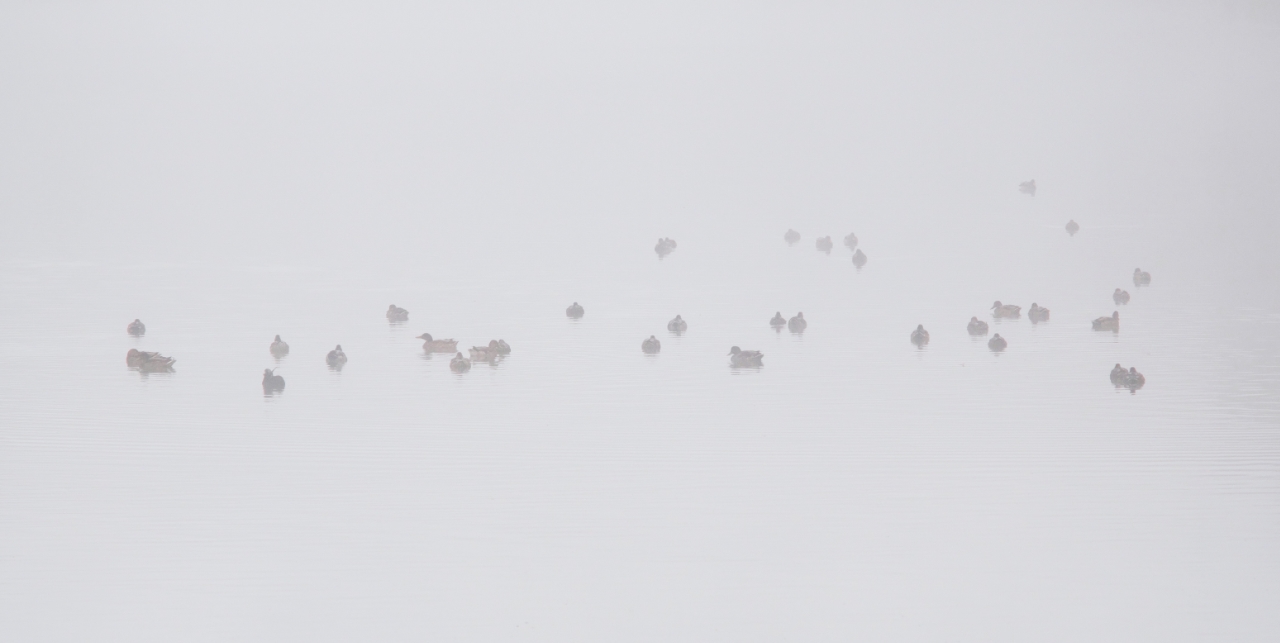
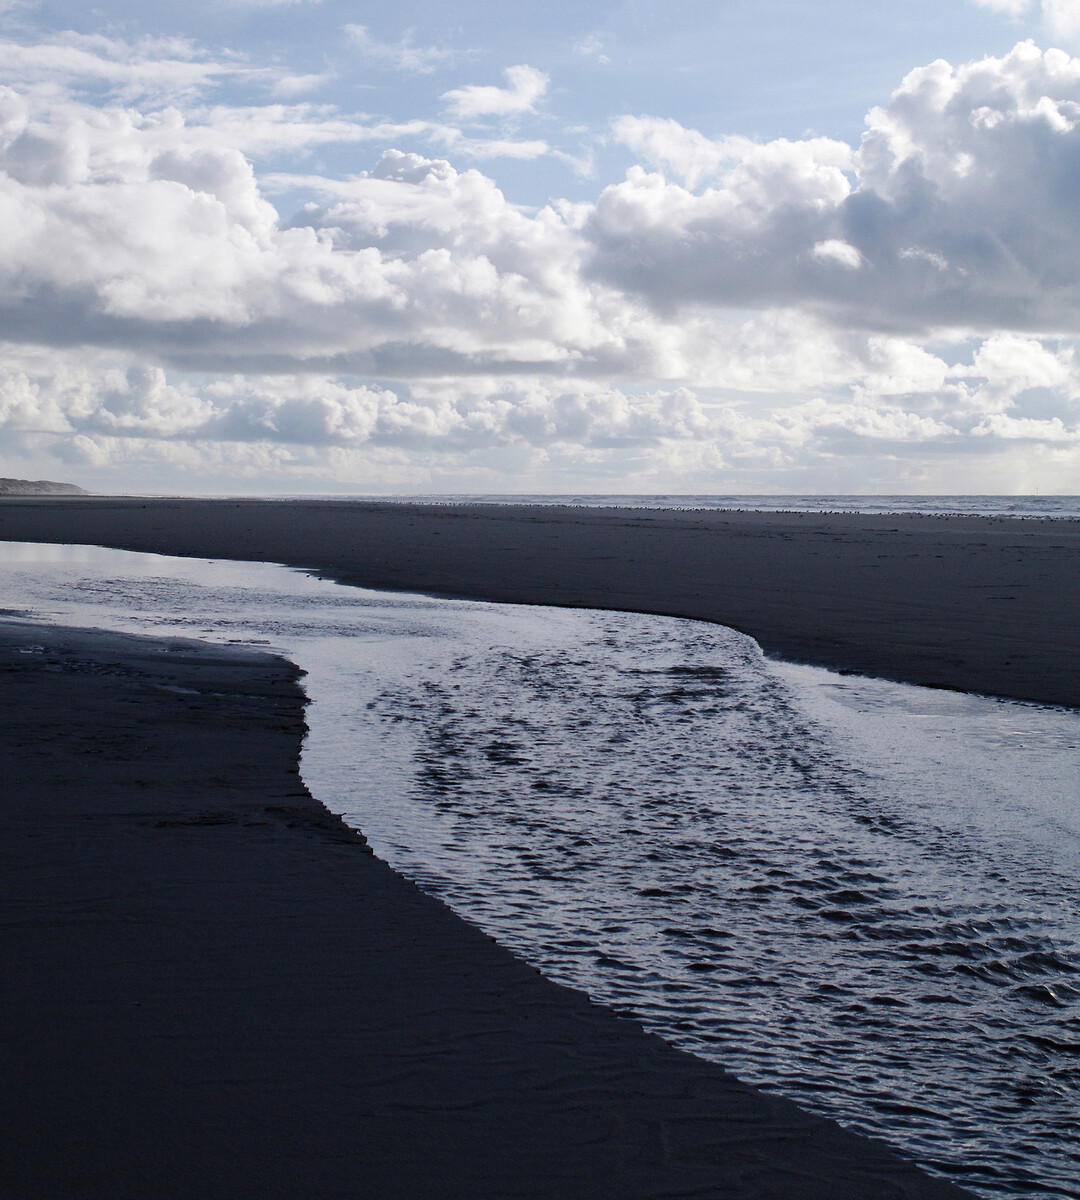
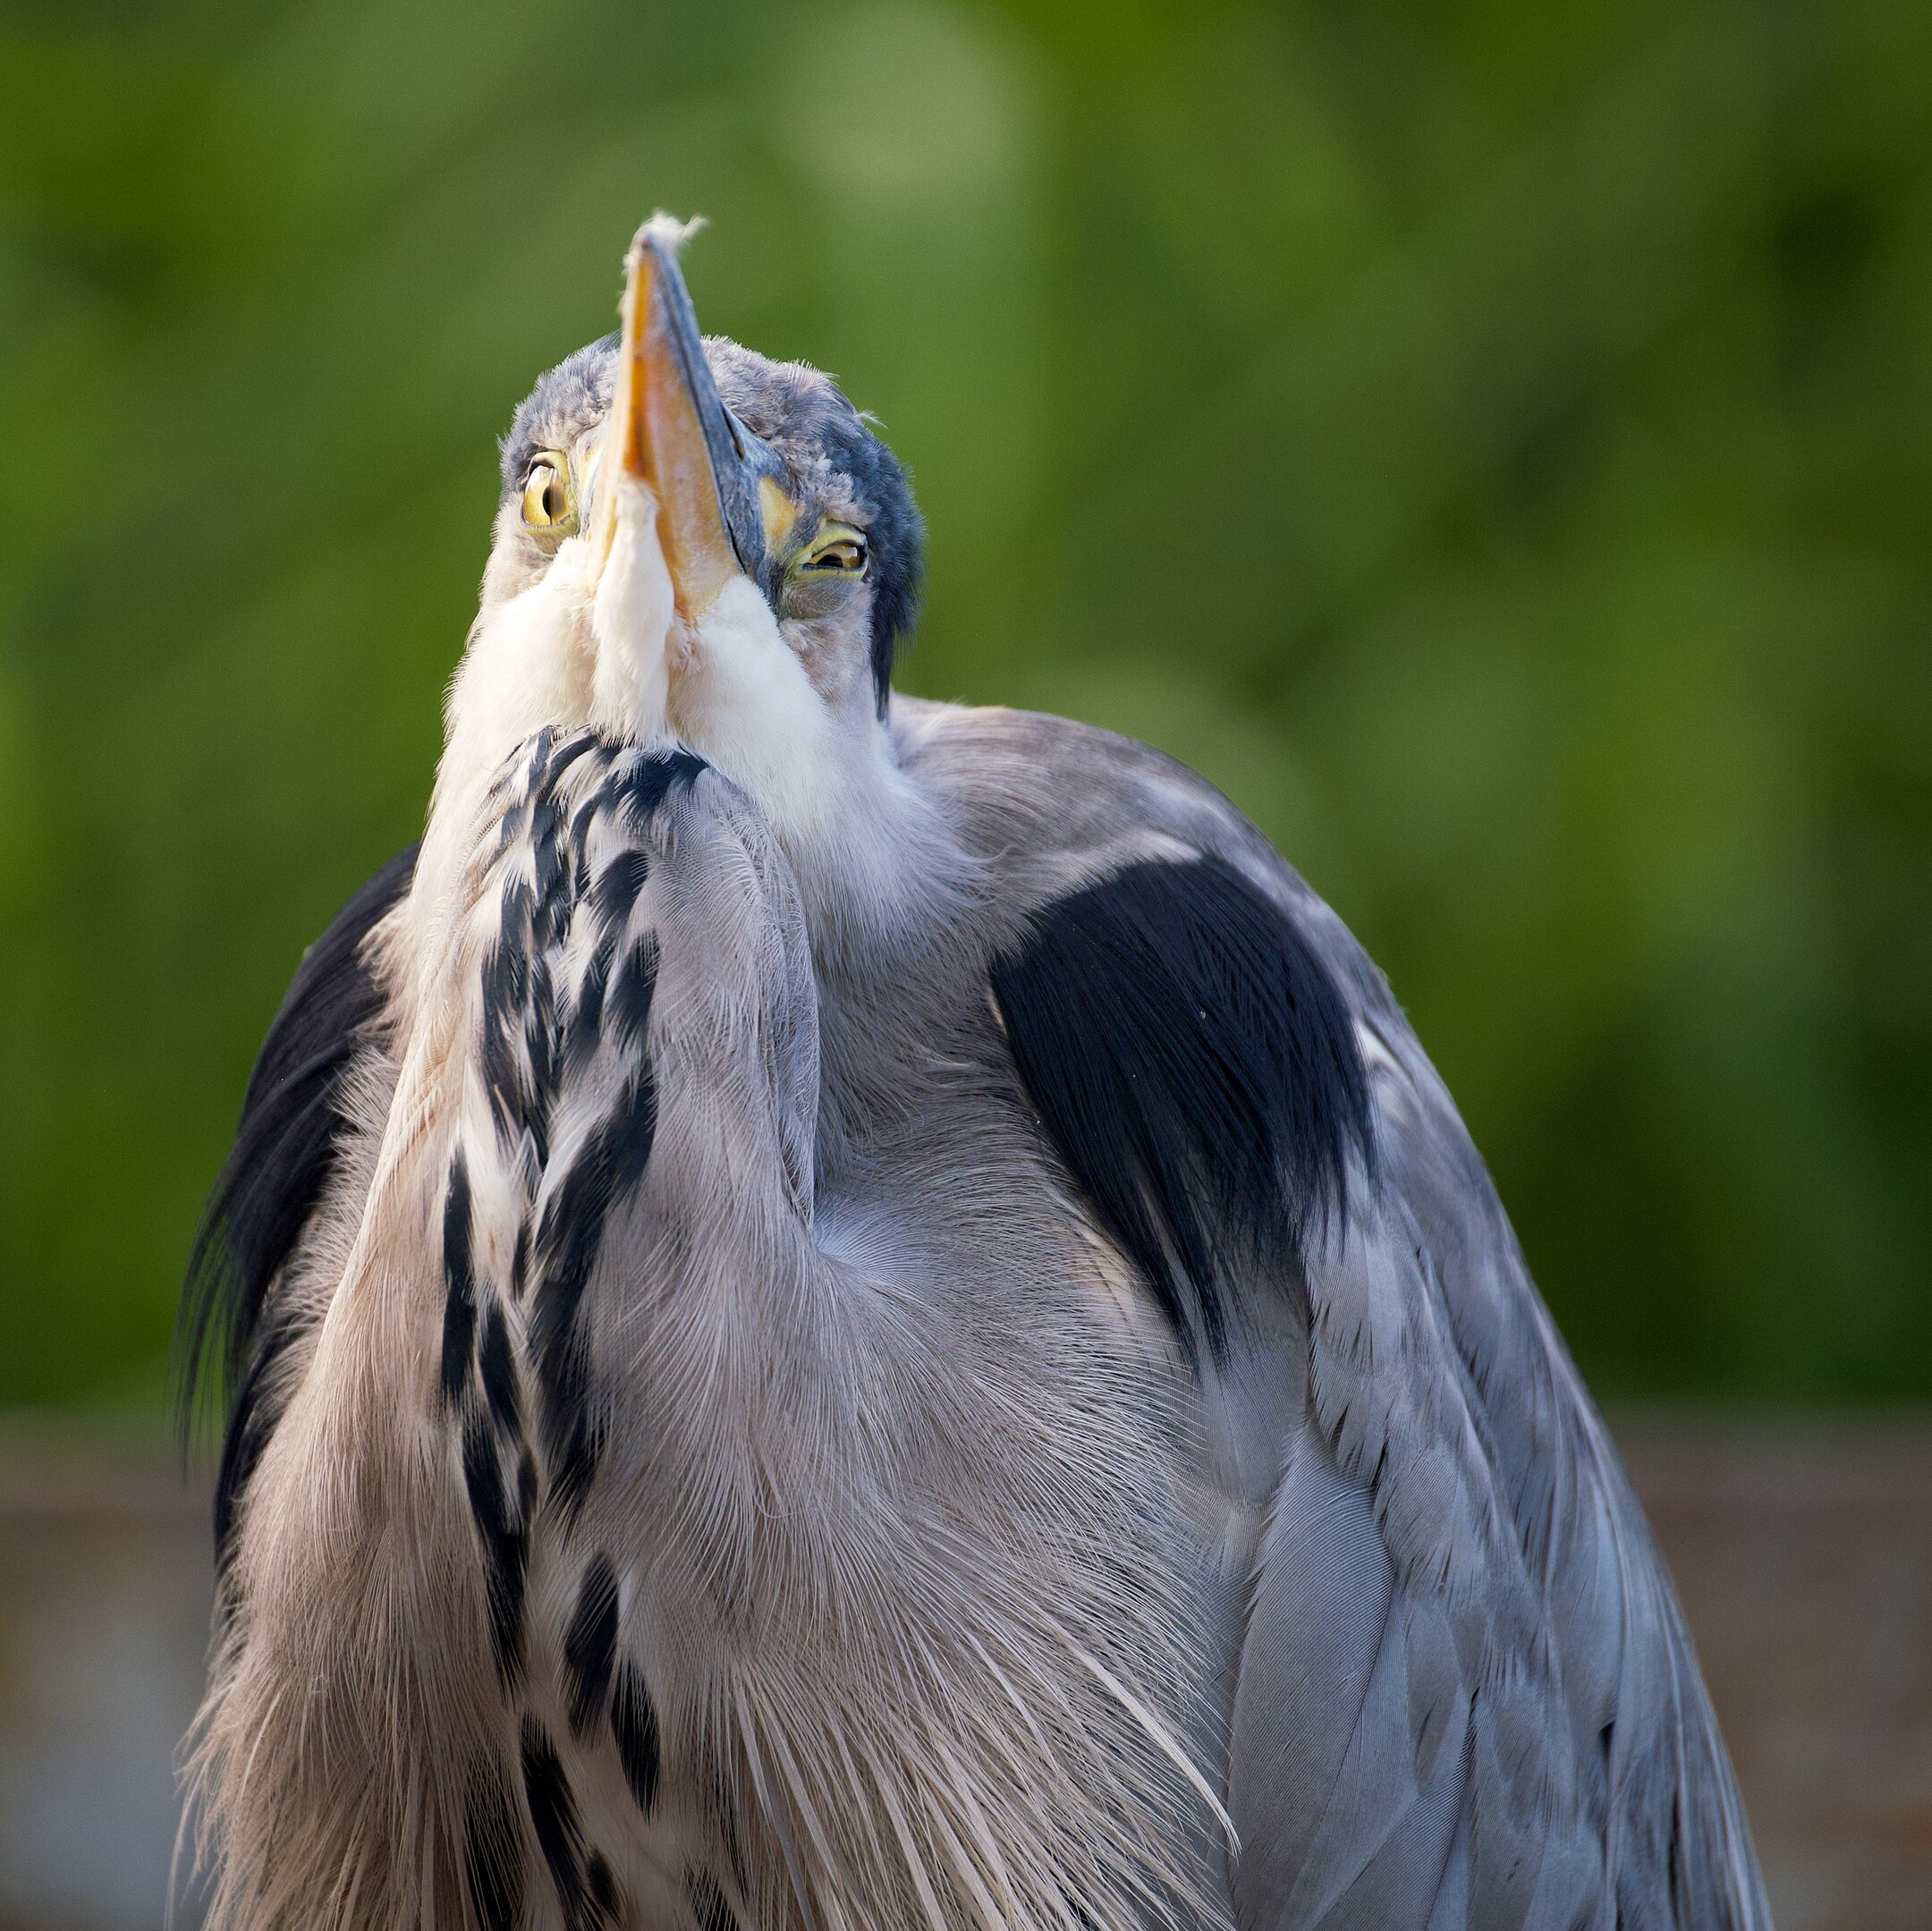
Pics or it didn't happen!
These are some of my favorite shots captured across the last couple of years using a variety of cameras (including but not limited to a late-70s Canon A35F rangefinder, multiple mid-2000s Pentax DSLRs with various vintage lenses, an iPhone 13 mini, and a Fujifilm X-T4, which I've adapted some of those vintage lenses to). There's more over here!
CV
Or resume if you prefer.
Available upon request until/unless it becomes a bit more interesting (or I'm actively looking for a job) – so far, apart from my current software engineering and systems administration job at SüdWestStrom, it's really only education plus teaching/research assistance at the Database Systems Research Group at the University of Tübingen.
Contact
Want to get in touch? Feel free to drop me an email to the address that the following JavaScript snippet evaluates to.
((crypt) => {
    const rot13 = c => {
        c = c.codePointAt(0);
        let d = c + 13;
        if (d > (c <= 90 ? 90 : 122)) {
            d -= 26;
        }
        return String.fromCodePoint(d);
    }
    const backwards = s => s.split("").reverse().join("");
    return backwards(crypt.replace(/[a-z]/gi, rot13));
})("zbp.tavferbqunba@vu");
...okay, okay, I get it, you can also click here and I'll make your browser evaluate that bit of code for you.


